---
title: "World Map Locations"
description: "An interactive map visualization to plot geospatial data points as markers, heatmaps, or clustered markers on a world map background."
group: Charts
tags: [Visualization, Map, Dashboard, GeoSpatial, Heatmap, Clusters, Markers]
---
import { Aside, Steps } from '@astrojs/starlight/components';
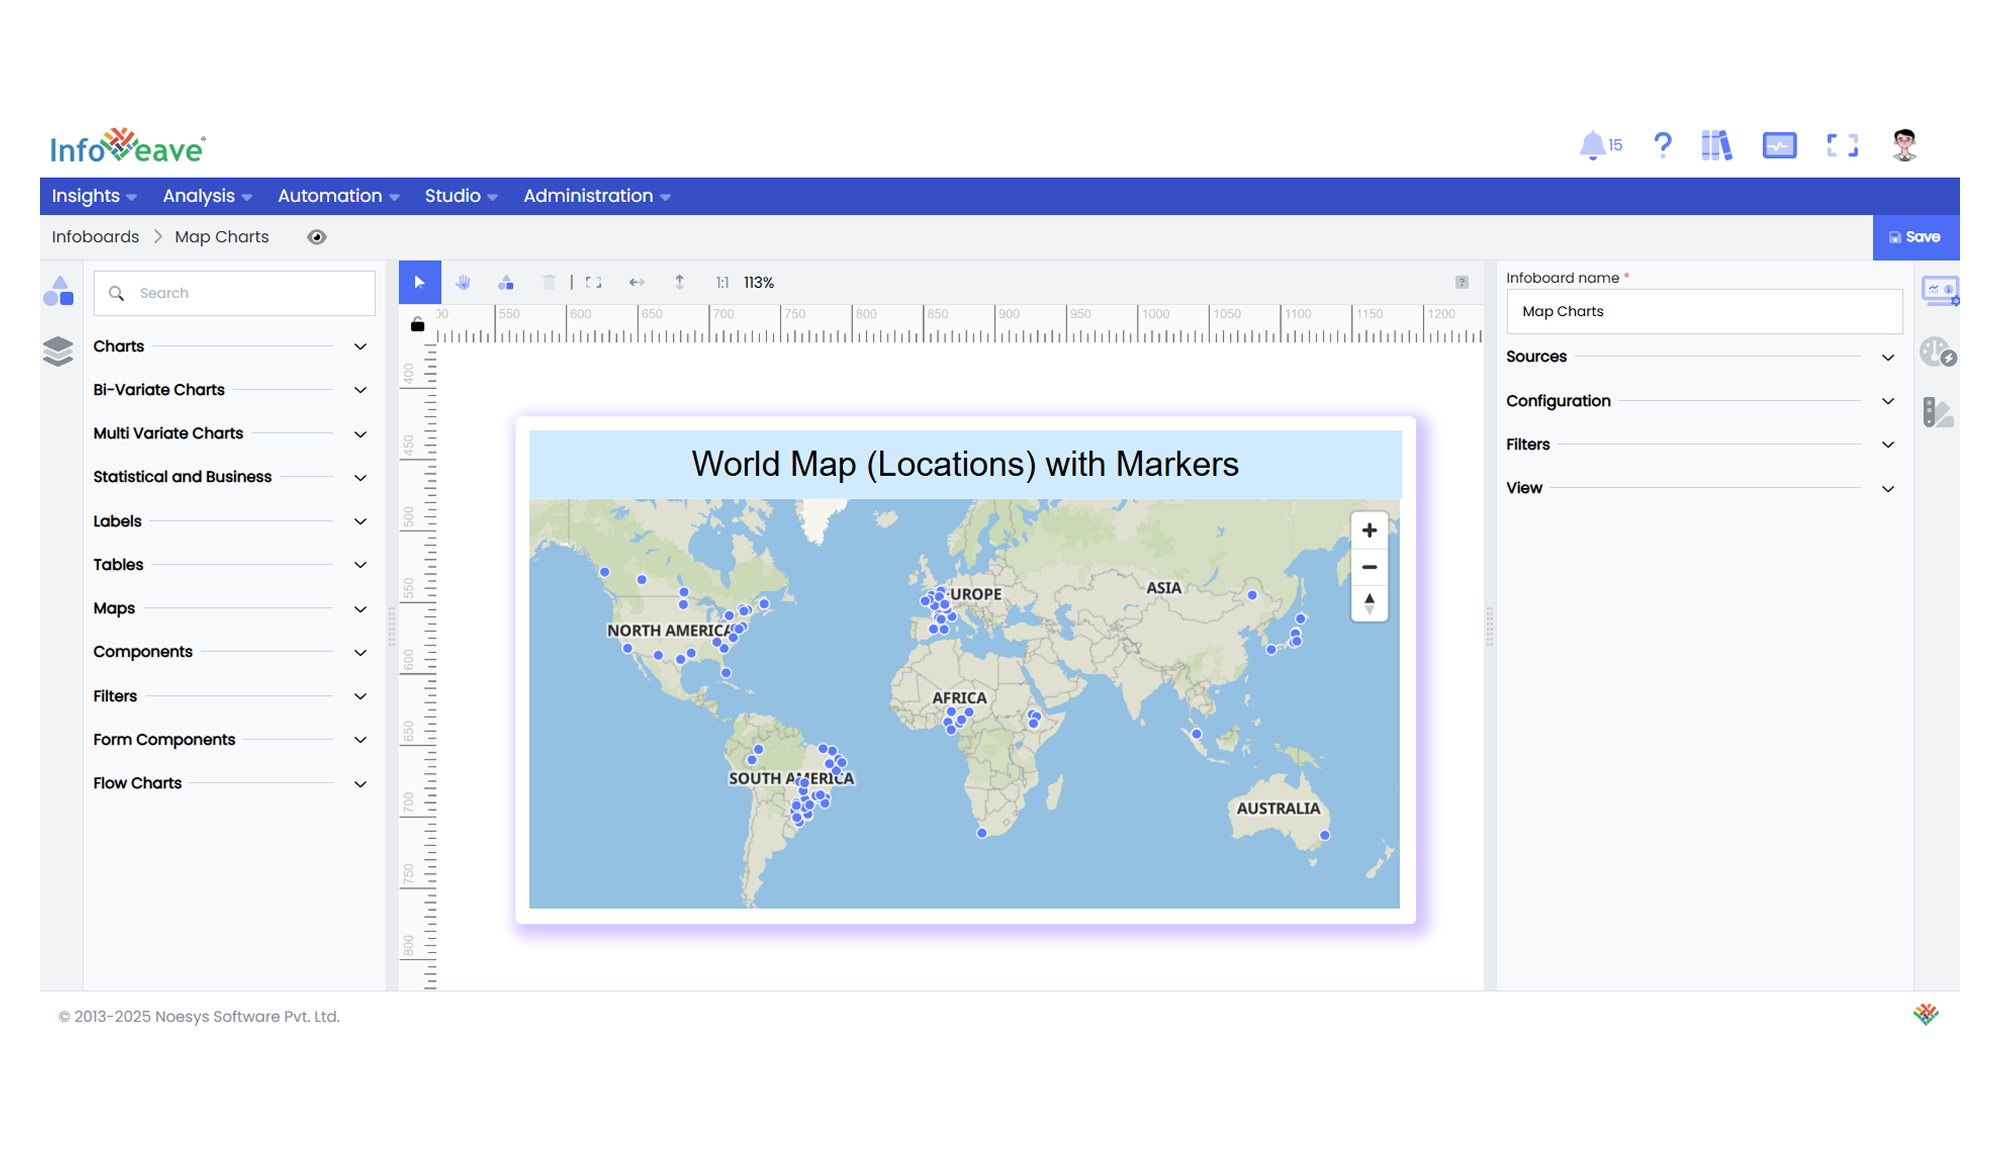
# World Map Locations
The **World Map Location** component allows visualizing geospatial data over an interactive map.
It supports plotting locations using **Markers**, **Heatmaps**, or **Clustered Markers** based on latitude and longitude values.
This visualization is ideal for understanding data distribution, density, and patterns across geographies.
**Use cases:**
- Displaying **event or asset locations** worldwide.
- Visualizing **density or intensity distributions** with heatmaps.
- Highlighting **grouped clusters of points** based on proximity.
- Mapping **regional contributions or activity zones**.
---
## ⚙️ Setup
1. Drag the **World Map Location** widget from the chart library onto your designer workspace.
2. Select the chart.
3. Go to the [Widget Configuration](/insights-v8/guide-to-infoboard-designer/customize-panel/configure/) tab in the Configuration panel.
4. Under the Configuration panel tab, select the [Basic Configuration](/insights-v8/guide-to-infoboard-designer/customize-panel/configure/#basic) option to access essential settings for the map.
5. Select the [Source](/insights-v8/guide-to-infoboard-designer/customize-panel/setup/#sources) from which the chart will fetch its data.
6. Map:
- **[Measures](/studio-v8/datasources/measures-dimensions-and-hierarchies/)** — Numeric value(s) optionally used for heatmaps or tooltips.
- **[Dimension (Latitude)](/studio-v8/datasources/measures-dimensions-and-hierarchies/)** — The latitude coordinate for each data point.
- **[Dimension (Longitude)](/studio-v8/datasources/measures-dimensions-and-hierarchies/)** — The longitude coordinate for each data point.
- **[Group](/studio-v8/datasources/measures-dimensions-and-hierarchies/)** — (Optional) Categorical value for differentiating points by color or cluster.
7. Optionally add a **Date** field for time-based filtering.
---
## 📊 Basic Configuration
| Configuration Item | Description |
|:---------------------|:-------------|
| **[Source](/insights-v8/guide-to-infoboard-designer/customize-panel/setup/#sources)** | The data source to query for map values. |
| **[Measures](/studio-v8/datasources/measures-dimensions-and-hierarchies/)** | (Optional) Numeric values used for heatmap intensities or tooltips. |
| **[Dimension (Latitude)](/studio-v8/datasources/measures-dimensions-and-hierarchies/)** | Numeric value representing the latitude position. |
| **[Dimension (Longitude)](/studio-v8/datasources/measures-dimensions-and-hierarchies/)** | Numeric value representing the longitude position. |
| **[Group](/studio-v8/datasources/measures-dimensions-and-hierarchies/)** (optional) | Categorical field to assign colors, icons, or clusters. |
| **Date Field** (optional) | Enables date-based filtering and drilldown capability. |
---
## 🎨 Chart Customizations
| Category | Options & Description |
|:----------------------------|:-----------------------------------------------------------|
| **[General](/insights-v8/guide-to-infoboard-designer/customize-panel/customization-tab/#general)** | Theme, background, border, and interactivity options. |
| **[Title](/insights-v8/guide-to-infoboard-designer/customize-panel/customization-tab/#title)** | Chart title, font, alignment, and visibility settings. |
| **[Sorting](/insights-v8/guide-to-infoboard-designer/customize-panel/customization-tab/#sorting)** | Control sorting of data points based on categories or measures. |
| **[ToolTip](/insights-v8/guide-to-infoboard-designer/customize-panel/customization-tab/#tooltip)** | Customize tooltip content, format, and value color. |
| **Map Options** | Select map style (Basic, DataViz, Satellite), max zoom, animation, and handling of unknown locations. |
| **Markers Options** | Configure marker type, size, color, stroke, and appearance per group. |
| **Heatmap Options** | Define color scale, inverse coloring, point size, and stroke styling for heatmap overlays. |
| **Cluster Options** | Adjust cluster radius, color steps, cluster point styling, and expansion behavior. |
| **Others** | Set display mode: **Markers**, **Heatmap**, or **Clustered Markers**. |
---
## 🗺️ Example Visualization