---
title: "Theme River"
description: "A flowing stream-like visualization that displays multiple data series over time, ideal for illustrating category-based temporal distributions."
group: Charts
tags: [Visualization, Chart, Dashboard, StreamGraph, ThemeRiver, TimeSeries]
---
import { Aside, Steps } from '@astrojs/starlight/components';
# Theme River
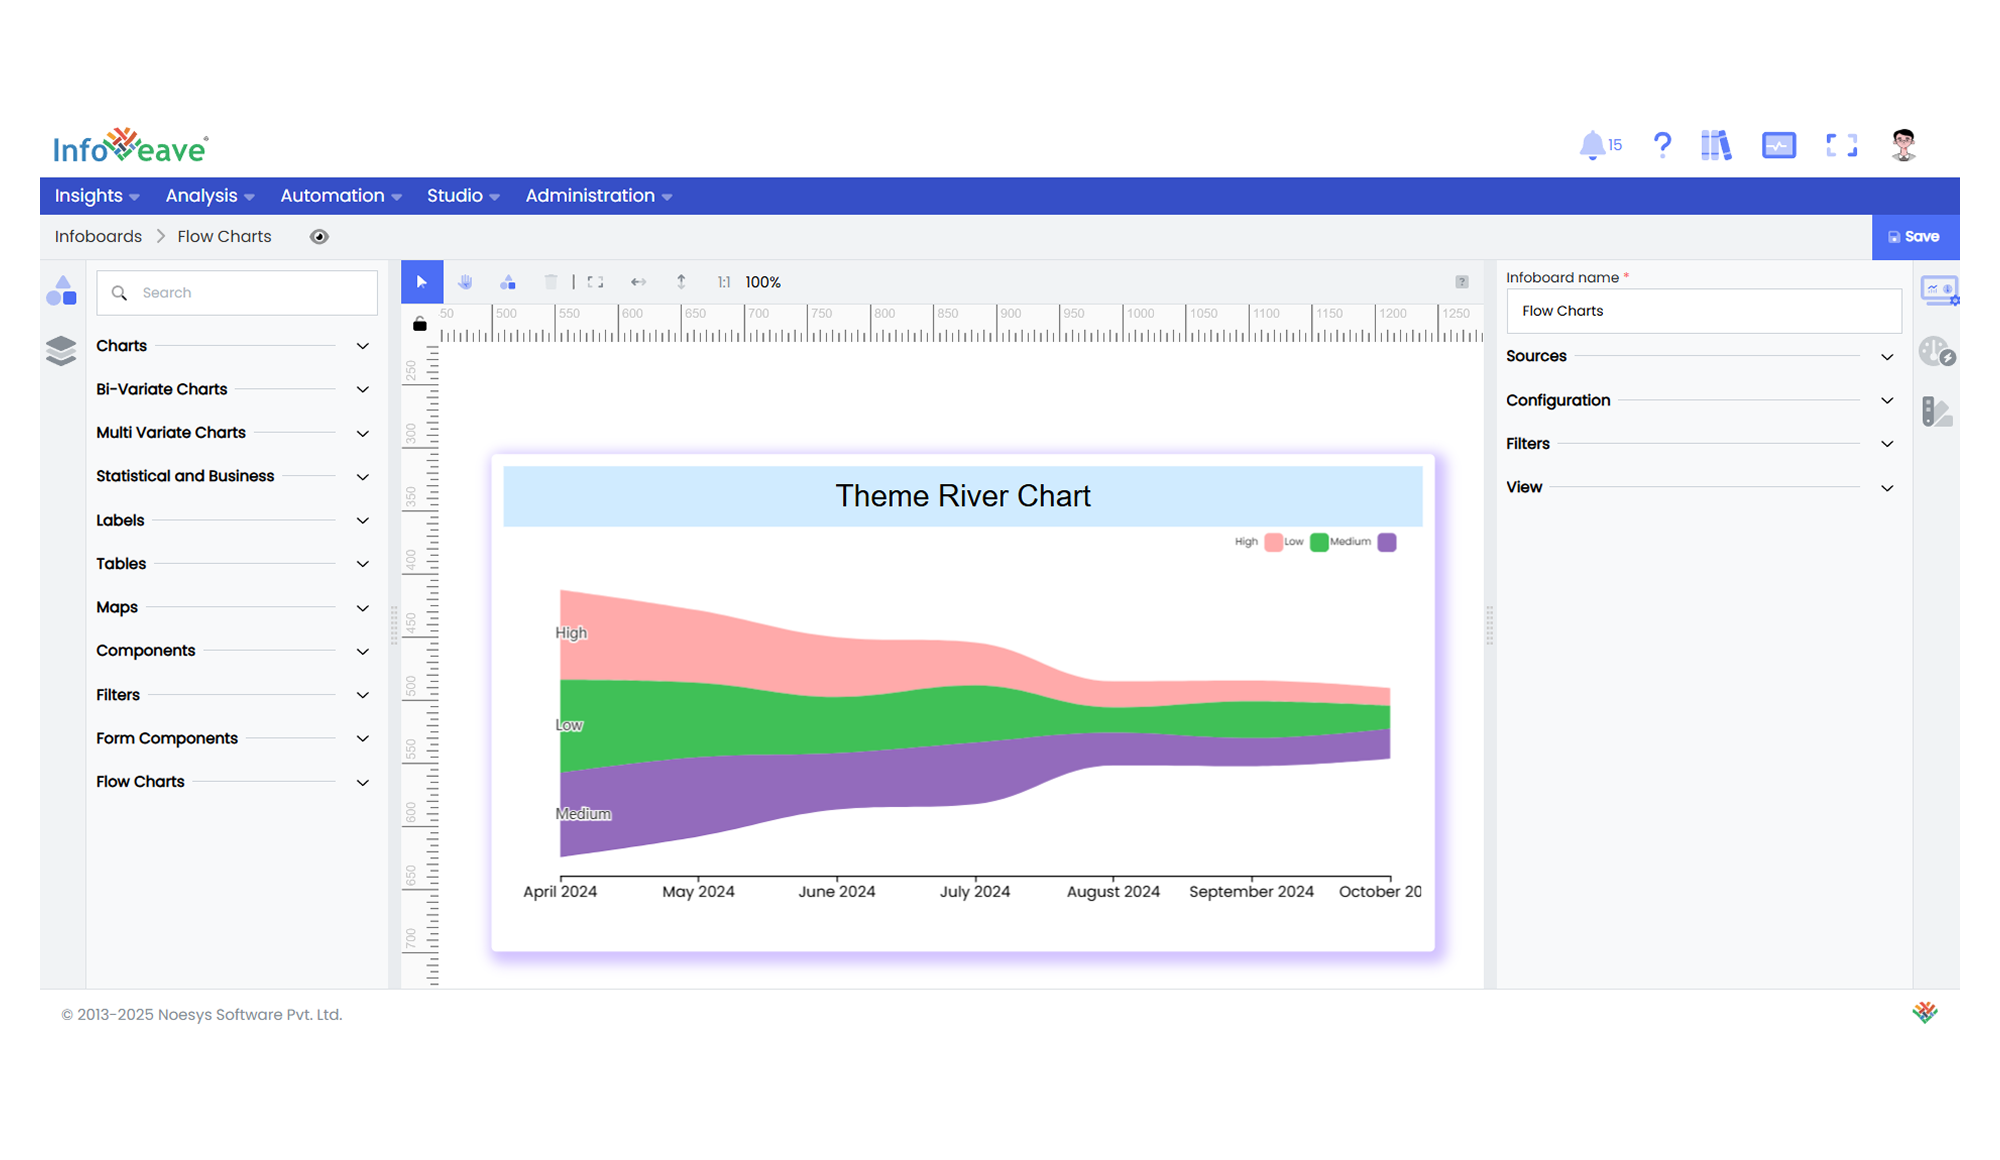
The **Theme River Chart** (also called StreamGraph) is a time-series visualization where multiple categories are displayed as flowing, stacked streams over a continuous timeline.
It’s useful for understanding how the distribution of different categories changes over time while maintaining a visual sense of overall volume.
**Use cases:**
- Show how **sales by product category** evolved over time.
- Visualize **topic trends, social mentions, or events over a period**.
- Track **market share of brands or segments** over time.
---
## ⚙️ Setup
1. Drag the **Theme River Chart** widget from the chart library onto your designer workspace.
2. Select the chart.
3. Go to the [Widget Configuration](/insights-v8/guide-to-infoboard-designer/customize-panel/configure/) tab in the Configuration panel.
4. Under the Configuration panel tab, select the [Basic Configuration](/insights-v8/guide-to-infoboard-designer/customize-panel/configure/#basic) option to access essential settings for the chart.
5. Select the [Source](/insights-v8/guide-to-infoboard-designer/customize-panel/setup/#sources) from which the chart will fetch its data.
6. Map:
- **[Measure](/studio-v8/datasources/measures-dimensions-and-hierarchies/)** — Numeric value.
- **[Group](/studio-v8/datasources/measures-dimensions-and-hierarchies/)** — Categorical value for the stream layers.
- **[Date](/studio-v8/datasources/measures-dimensions-and-hierarchies/)** — Date dimension to drive the time axis.
---
## 📊 Basic Configuration
| Configuration Item | Description |
|:---------------------|:-------------|
| **[Source](/insights-v8/guide-to-infoboard-designer/customize-panel/setup/#sources)** | The data source to query for chart values. |
| **[Measure](/studio-v8/datasources/measures-dimensions-and-hierarchies/)** | Numeric value to display for each category and date. |
| **[Group](/studio-v8/datasources/measures-dimensions-and-hierarchies/)** | The category that splits the stream flows. |
| **[Date](/studio-v8/datasources/measures-dimensions-and-hierarchies/)** | The time dimension over which to spread the streams. |
---
## 🎨 Chart Customizations
| Category | Options & Description |
|:----------------------------|:-----------------------------------------------------------|
| **[General](/insights-v8/guide-to-infoboard-designer/customize-panel/customization-tab/#general)** | Theme, background, animations, and accessibility options. |
| **[Title](/insights-v8/guide-to-infoboard-designer/customize-panel/customization-tab/#title)** | Chart title, font, alignment, and visibility settings. |
| **[Sorting](/insights-v8/guide-to-infoboard-designer/customize-panel/customization-tab/#sorting)** | Control stream stacking order by sorting categories. |
| **[Grid](/insights-v8/guide-to-infoboard-designer/customize-panel/customization-tab/#grid)** | Adjust chart padding, spacing, and margins. |
| **[Legend](/insights-v8/guide-to-infoboard-designer/customize-panel/customization-tab/#legends)** | Position, layout, and show/hide legends for each category stream. |
| **[Single Axis](/insights-v8/guide-to-infoboard-designer/customize-panel/customization-tab/#single-axis)** | Customize date axis label format, min/max, interval, and label rotation. |
| **[Series](/insights-v8/guide-to-infoboard-designer/customize-panel/customization-tab/#series-customization)** | Enable/disable labels, overlap handling, label orientation, and assign custom colors. |
| **[Tooltip](/insights-v8/guide-to-infoboard-designer/customize-panel/customization-tab/#tooltip)** | Configure tooltip content, formatting, and trigger settings. |
---
## 📊 Example Visualization