---
title: "Svg"
description: "A custom shape-based chart visualization where data values are mapped onto regions within an SVG image, enabling highly tailored visual storytelling."
group: Charts
tags: [Visualization, Chart, Dashboard, SVG, Custom Shapes, Heatmap]
---
import { Aside, Steps } from '@astrojs/starlight/components';
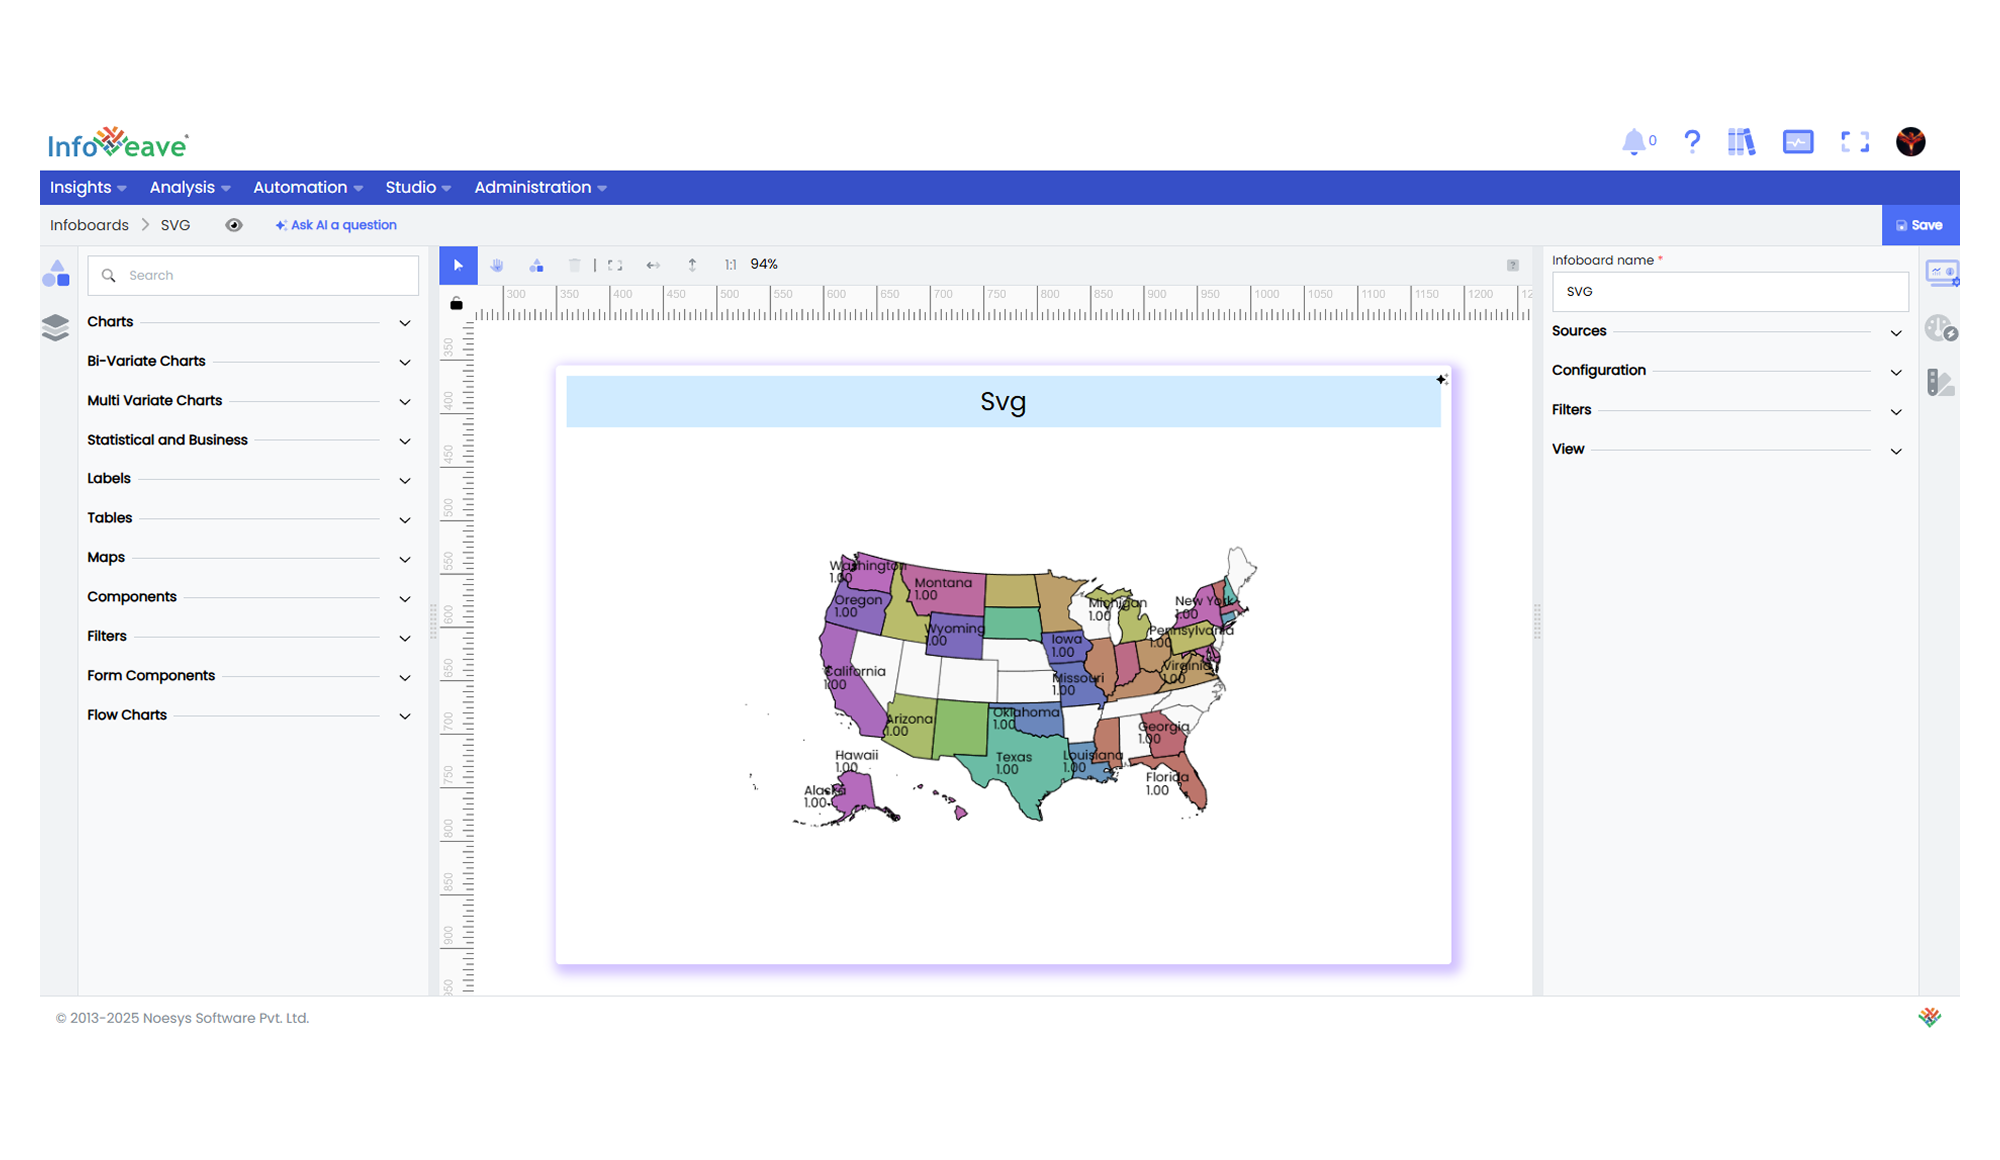
# Svg
The **SVG Chart** visualizes data by mapping values onto elements within an SVG image.
It’s ideal for **custom geographical maps**, **floor plans**, or **bespoke diagrams** where standard chart types don't apply.
Unlike conventional charts, each area or path inside the SVG represents a data point, colored or shaded based on its associated value.
**Use cases:**
- Visualizing **data distribution across a custom map** or **layout diagram**.
- Displaying **heatmaps over vector-based images**.
- Custom **spatial analytics dashboards** where standard grids and axes aren’t suitable.
---
## ⚙️ Setup
1. Drag the **SVG Chart** widget from the chart library onto your designer workspace.
2. Select the chart.
3. Go to the [Widget Configuration](/insights-v8/guide-to-infoboard-designer/customize-panel/configure/) tab in the Configuration panel.
4. Under the Configuration panel tab, select the [Basic Configuration](/insights-v8/guide-to-infoboard-designer/customize-panel/configure/#basic) option to access essential settings for the SVG Chart.
5. Select the [Source](/insights-v8/guide-to-infoboard-designer/customize-panel/setup/#sources) from which the chart will fetch its data.
6. Map:
- **[Measure (Value)](/studio-v8/datasources/measures-dimensions-and-hierarchies/)** — Numeric value controlling the fill color or intensity for each SVG region.
- **[Dimension (Name)](/studio-v8/datasources/measures-dimensions-and-hierarchies/)** — Name of the path or region within the SVG to associate data with.
7. Optionally add a **Date** field for time-based filtering.
8. Upload or select an SVG image under the **Image** configuration option.
9. Define the SVG element attribute to target (default is `name`) under **Name Property**.
---
## 📊 Basic Configuration
| Configuration Item | Description |
|:---------------------|:-------------|
| **[Source](/insights-v8/guide-to-infoboard-designer/customize-panel/setup/#sources)** | The data source to query for chart values. |
| **[Measure (Value)](/studio-v8/datasources/measures-dimensions-and-hierarchies/)** | Numeric value mapped to color intensity of the SVG regions. |
| **[Dimension (Name)](/studio-v8/datasources/measures-dimensions-and-hierarchies/)** | Attribute within the SVG paths representing data categories. |
| **Date Field** (optional) | Enables date-based filtering and drilldown capability. |
---
## 🎨 Chart Customizations
| Category | Options & Description |
|:----------------------------|:-----------------------------------------------------------|
| **[General](/insights-v8/guide-to-infoboard-designer/customize-panel/customization-tab/#general)** | Theme, background, borders, and interactivity settings. |
| **[Title](/insights-v8/guide-to-infoboard-designer/customize-panel/customization-tab/#title)** | Chart title, font, alignment, and visibility options. |
| **[Position](/insights-v8/guide-to-infoboard-designer/customize-panel/customization-tab/#position)** | Adjust horizontal and vertical positioning of the svg within the chart. |
| **[HeatMap](/insights-v8/guide-to-infoboard-designer/customize-panel/customization-tab/#heatmap)** | Define color ranges and gradients for numeric values. |
| **[Series](/insights-v8/guide-to-infoboard-designer/customize-panel/customization-tab/#series-customization)** | Control fill color, layout size, label overlap behavior, and tooltip settings for each path. |
| **[Tooltip](/insights-v8/guide-to-infoboard-designer/customize-panel/customization-tab/#tooltip)** | Configure hover tooltips for regions, including custom content and value formats. |
| **Others** | Upload **SVG Image**, define **Name Property**, and set **Size** for SVG layout scaling. |
---
## 📊 Example Visualization