---
title: "Process Flow"
description: "A dynamic process flow visualization that displays nodes, connections, and durations between steps in a process."
group: Charts
tags: [Visualization, Chart, Dashboard, Process Flow, Workflow, Nodes and Edges]
---
import { Aside, Steps } from '@astrojs/starlight/components';
# Process Flow
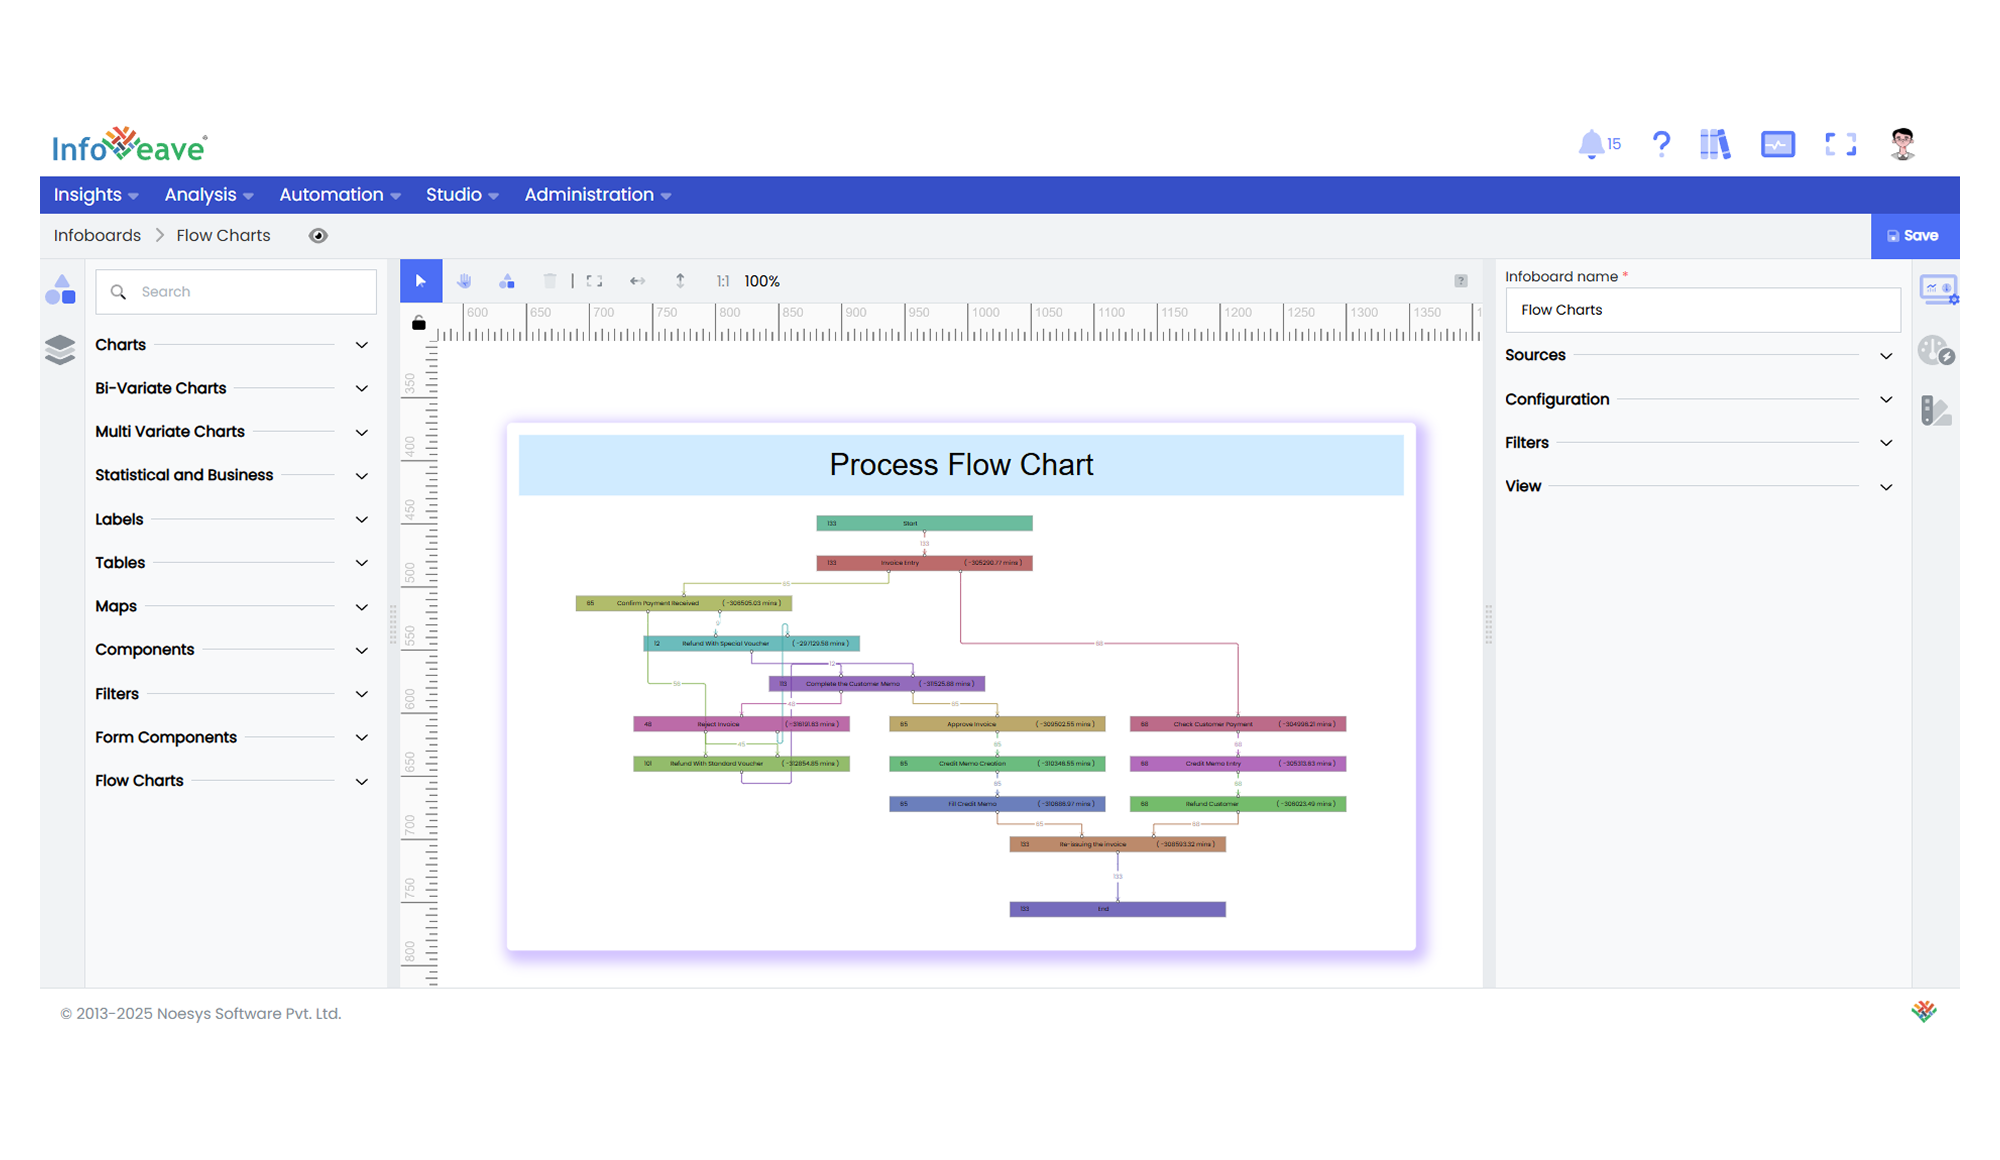
The **Process Flow** is an advanced visualization component that displays processes as a series of connected nodes, with directional edges showing the flow between steps. It automatically calculates and displays process durations, path frequencies, and can handle complex branching workflows.
This component is particularly useful for visualizing business processes, customer journeys, system workflows, or any sequence of connected events where understanding timing and path frequency is important.
**Key features:**
- Customizable **node appearance** with value and duration displays
- Multiple **edge/connection types** (straight, bezier, stepped)
- Interactive **zoom and pan** capabilities
- Built-in **duration calculations** with customizable units
- Process **frequency tracking** (counts between nodes)
**Use cases:**
- Customer journey mapping through conversion funnels
- Business process workflow visualization
- System architecture and data flow diagrams
- Manufacturing process tracking
- Incident response workflow analysis
---
## ⚙️ Setup
1. Drag the **Process Flow** widget from the chart library onto your designer workspace.
2. Select the chart.
3. Go to the [Widget Configuration](/insights-v8/guide-to-infoboard-designer/customize-panel/configure/) tab in the Configuration panel.
4. Under the Configuration panel tab, select the [Basic Configuration](/insights-v8/guide-to-infoboard-designer/customize-panel/configure/#basic) option.
5. Select the [Source](/insights-v8/guide-to-infoboard-designer/customize-panel/setup/#sources) for the data.
6. Map the required fields:
- **[Value](/studio-v8/datasources/measures-dimensions-and-hierarchies/)** - Primary measure to display in nodes
- **[StartDate](/studio-v8/datasources/measures-dimensions-and-hierarchies/)** - Beginning timestamp of each process step
- **[EndDate](/studio-v8/datasources/measures-dimensions-and-hierarchies/)** - Completion timestamp of each process step
- **[Group](/studio-v8/datasources/measures-dimensions-and-hierarchies/)** - Process step/node identifier
- **[UniqueKey](/studio-v8/datasources/measures-dimensions-and-hierarchies/)** - Identifier for individual process instances
7. Optionally add a **Date** field for time-based filtering.
8. Enable **Hide Zero Values** to omit symbols with zero values if needed.
---
## 📊 Basic Configuration
| Configuration Item | Description |
|:-------------------|:------------|
| **[Source](/insights-v8/guide-to-infoboard-designer/customize-panel/setup/#sources)** | Data source providing the process flow records. |
| **[Value](/studio-v8/datasources/measures-dimensions-and-hierarchies/)** | Primary numerical measure displayed within each node. |
| **[StartDate](/studio-v8/datasources/measures-dimensions-and-hierarchies/)** | Required timestamp dimension marking when each process step began. |
| **[EndDate](/studio-v8/datasources/measures-dimensions-and-hierarchies/)** | Required timestamp dimension marking when each process step completed. |
| **[Group](/studio-v8/datasources/measures-dimensions-and-hierarchies/)** | Required categorical field identifying each process step (node). |
| **[UniqueKey](/studio-v8/datasources/measures-dimensions-and-hierarchies/)** | Required field providing unique identifiers for process instances. |
| **Date Field** (optional) | Optional temporal dimension for time-based filtering. |
---
## 🎨 Chart Customizations
| Category | Options & Description |
|:---------|:----------------------|
| **[General](/insights-v8/guide-to-infoboard-designer/customize-panel/customization-tab/#general)** | Modify the chart’s general appearance, including the background color, borders, shadows, and drill-out choices.
| **[Title](/insights-v8/guide-to-infoboard-designer/customize-panel/customization-tab/#title)** | Enable and customize chart title text, alignment, font, and color. |
| **Node** | Adjust node dimensions (width/height), appearance (background color/gradient, borders, radius), label formatting, value display options, and connection point styling. |
| **Link** | Select from 7 connection types (Straight/Bezier/Stepped etc.), customize line color/thickness/animation, arrowhead markers (type/size/color), and transition count labels. |
| **Layout** | Set flow direction (vertical/horizontal), choose layout algorithm (Longest-Path/Network-Simplex), adjust spacing (node/edge/rank gaps), and configure background grid patterns. |
| **Controls** | Manage control panel visibility and position (top/bottom + left/center/right), toggle zoom/fit-to-view/interactive functions. |
| **[Tooltip](/insights-v8/guide-to-infoboard-designer/customize-panel/customization-tab/#tooltip)** | Customize hover tooltips displaying step details, connection frequencies, and duration metrics with formatting options. |
---
## 📊 Example Visualization