---
title: Widget Configuration
description: Customize your Infoboard widgets with Infoveave's Configuration tabs. Adjust basic settings, apply drill downs, set fixed filters, and link reports for tailored data visualizations.
---
import { Aside, Steps } from '@astrojs/starlight/components';
# Widget Configuration
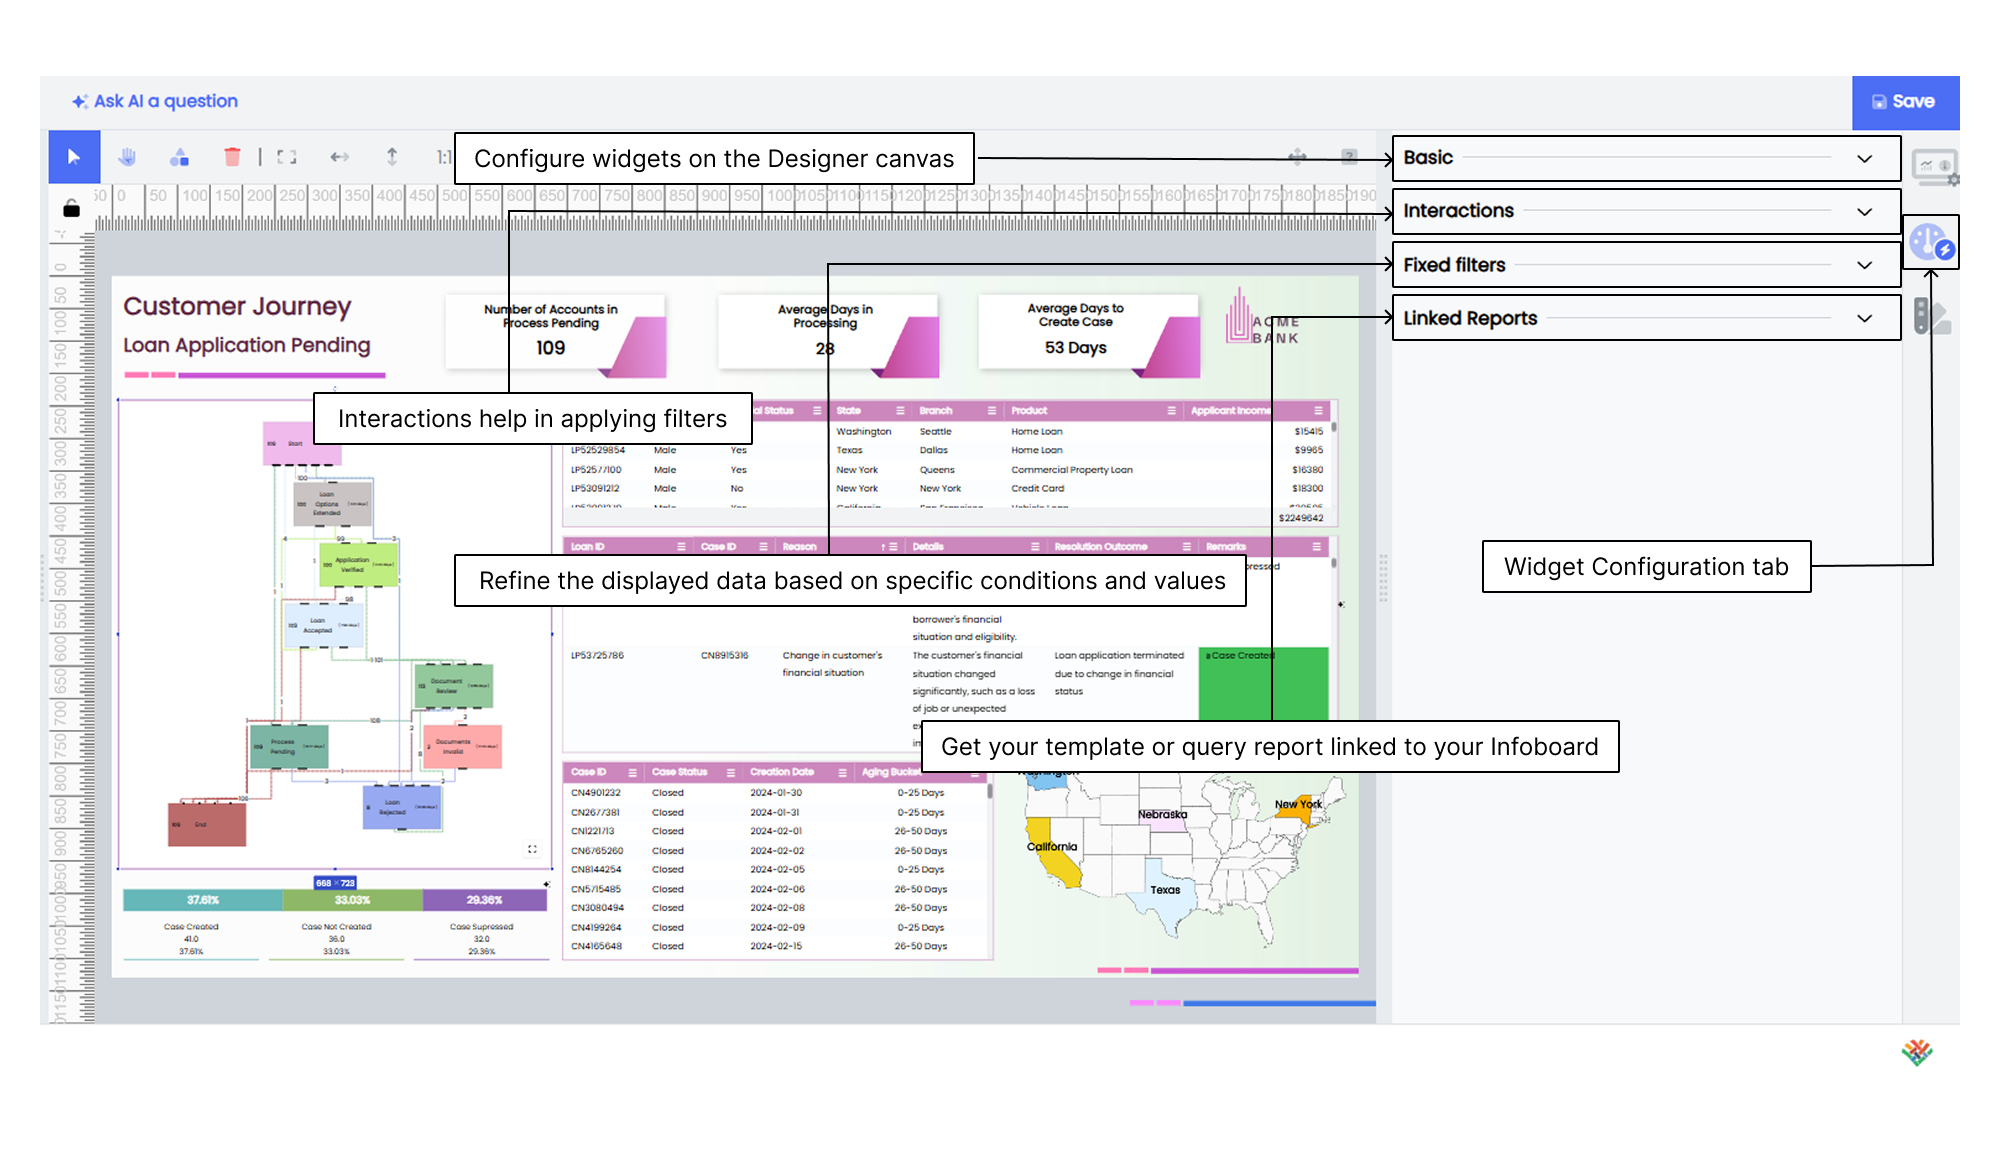
The **Widget Configuration** tab in the Customize panel allows you to setup the configuration of a widget like the datasource connections, interactions and drill downs, filters and linked reports.
## Basic
You configure your widgets within the Infoboard Designer to display insights by linking them to predefined Datasources. You assign the required measure values along dimensional axes and group them for effective categorization.
**Basic** is the essential starting point for configuring widgets within the Designer. Here, you find the key settings that help you fine-tune your widgets to match your specific needs.
To configure widgets on the Designer canvas, follow these steps.
1. Select the desired widget and drag it to the Designer canvas.
2. Click on the Widget Configuration option in the Customize panel and select the Basic option.
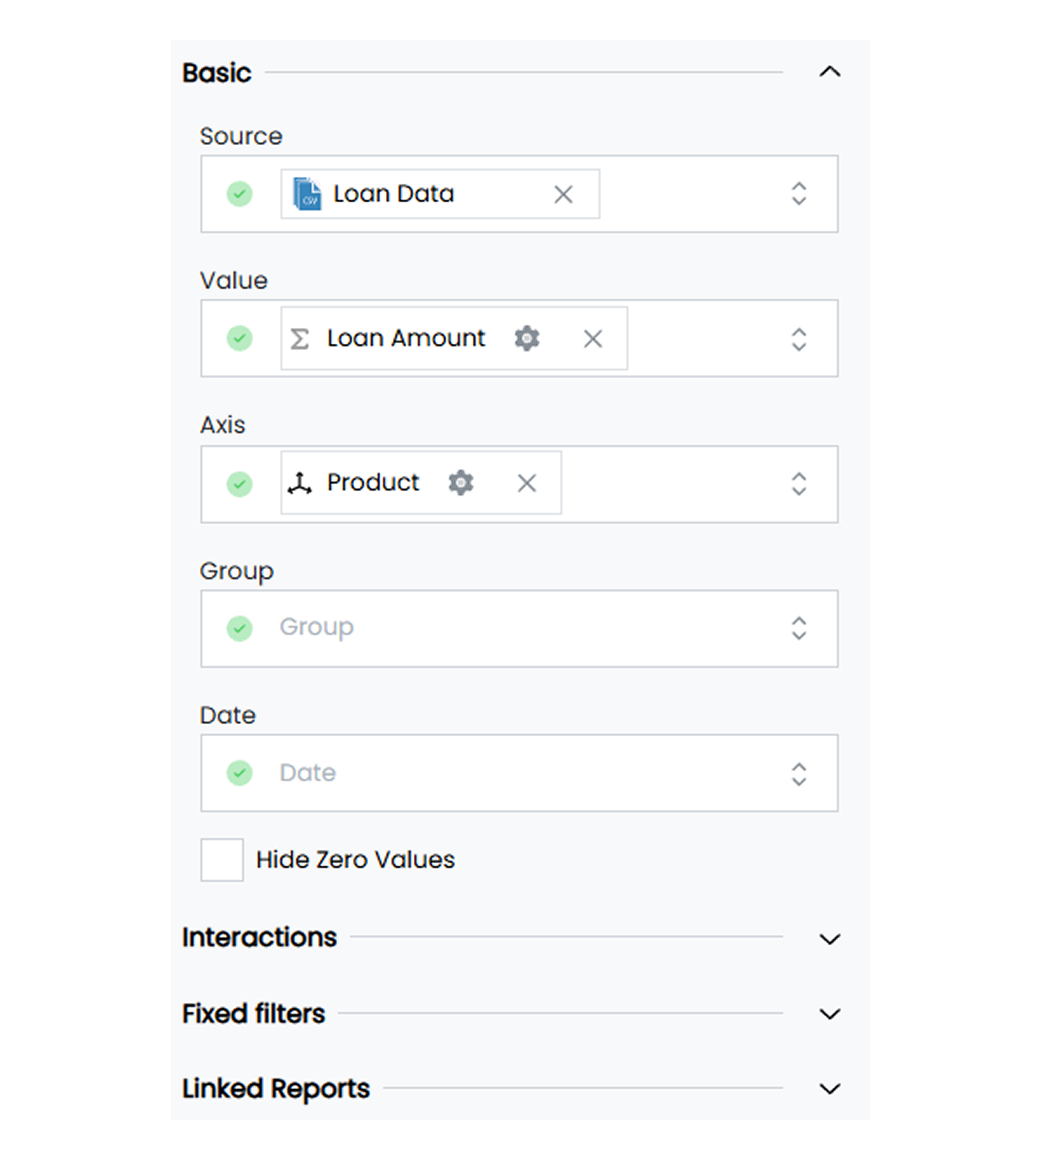
3. Define the available fields to configure the widget. The common fields used for configuring widgets include:
* **Source** Select the appropriate Datasource for the widget.
* **Value** Specify the value or measure to be displayed in the widget.
* **Axis** Configure the axis settings for the widget. For example, X-axis or Y-axis.
* **Group** Define grouping options for the widget to categorize data.
* **Date** If applicable, set the date or time range for the widget.
* **Other specific fields** Depending on the widget type, there may be additional fields specific to that widget. For example, size, dimension, rows, and columns.
4. Click on **Save** to save the widget configuration.
## Interactions
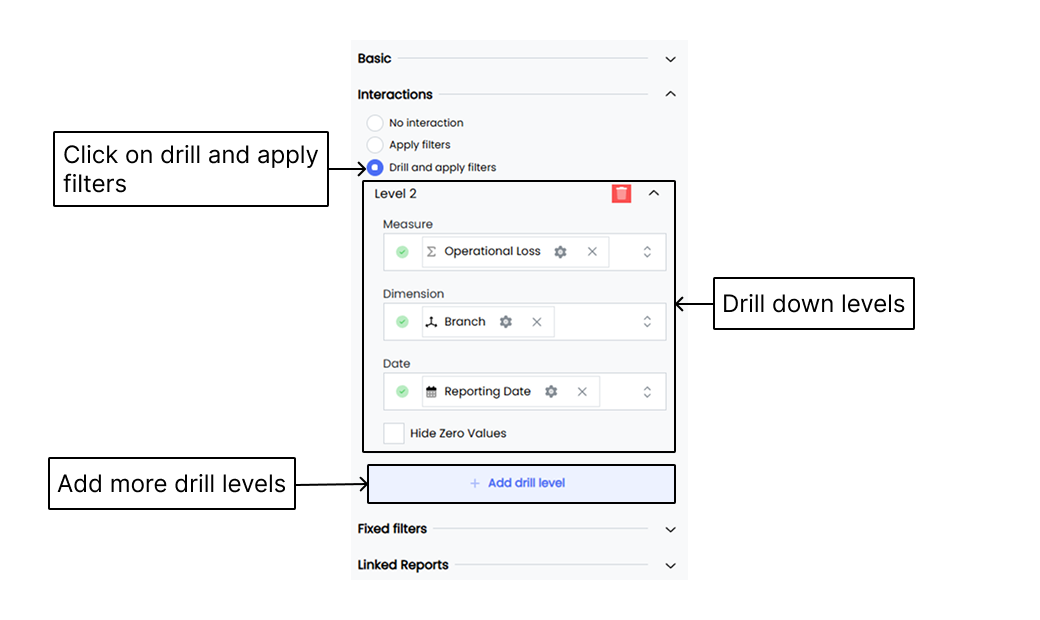
Drill and apply filters allow you to refine your data analysis by adding extra levels of detail to your visualizations. Follow these steps to set up drill and apply filters.
1. Select the desired widget to which you want to add the drill down.
2. Click on the **Widget Configuration** tab in the Customize panel.
3. Select the **Interactions** option.
4. Select **Drill and apply filters**.
5. Click on the **Add drill level** button to add a new drill down level.
6. Choose different measures and dimensions to analyze data at each level.
7. Click **Save** to save the added drill down.
## Fixed filters
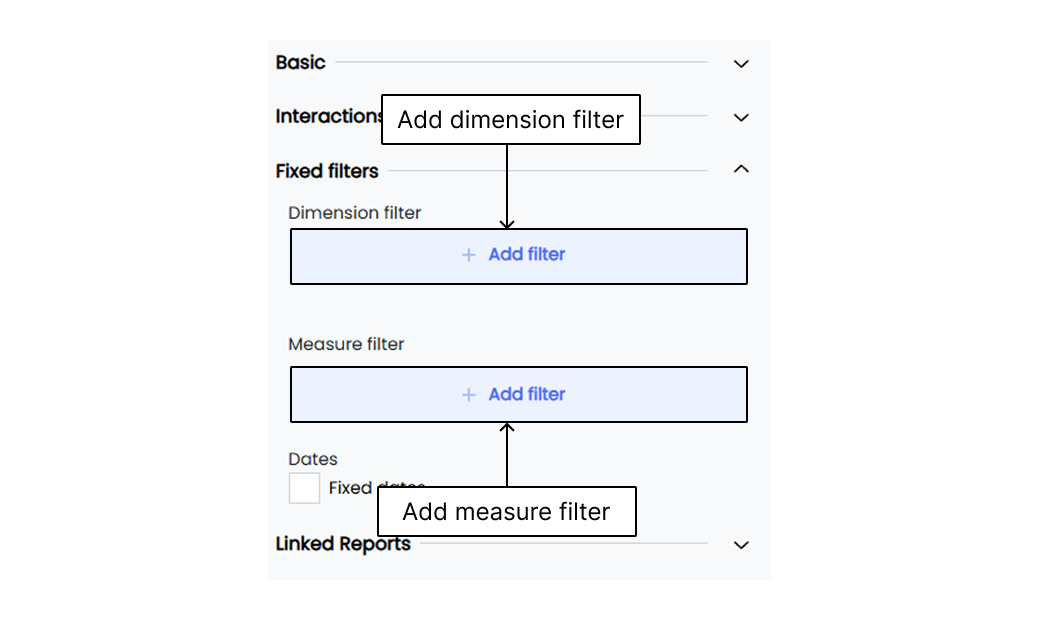
Fixed filters in Infoveave allow you to enhance the filtering capabilities of your widgets by adding dimension filters and measure filters. These filters help you refine the displayed data based on specific conditions and values. Here is how you configure them.
1. Select the desired widget to which you want to add the fixed filters.
2. Click on the Widget Configuration tab in the Customize panel.
3. Locate the Fixed filters section and click on **+ Add filter**. This allows you to add dimension filters and measure filters to the widget.
4. To configure a dimension filter:
* Select the desired dimension from the available options.
* Choose the condition that best suits your filtering requirement. For example, “are”, “are not”, “in”, or “not in”.
* Enter the dimension value that you want to filter by.
5. To configure a measure filter:
* Select the desired measure from the available options.
* Choose the condition that defines how the measure should be compared. For example, “greater than”, “less than”, “greater than or equal to”, “less than or equal to”, or “equals to”.
* If the value condition is selected, enter the specific value that the measure should be compared against.
* If the measure condition is selected, select the other measure from the available options that the current measure will be compared with.
6. If you need to add multiple measure filters, repeat the above steps to configure additional measure filters. The AND or OR condition option will appear, allowing you to choose whether all the filters should match (AND) or at least one filter should match (OR).
7. To apply fixed dates to the widget, select the **Fixed dates** checkbox option. It gives you the calendar, allowing you to set the widget to a particular date range.
8. Save the changes to the widget configuration.
## Linking reports to a widget
You can link your template or query [report](/insights-v8/insights-layout/download-infoboard-reports/) to your Infoboard on the widget of your choice. It helps you access the report directly from the Infoboard with ease.
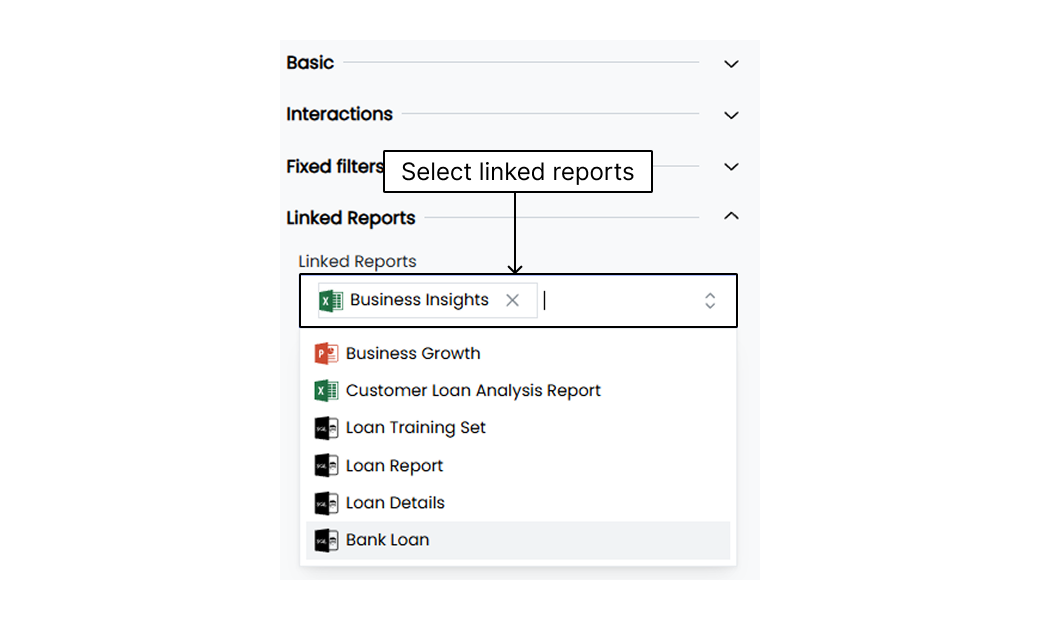
1. Select the desired widget to which you want to link the report.
2. Click on the **Widget Configuration** tab in the Customize panel.
3. Select the **Linked Reports** option.
4. Select the required report from the list of available reports.
5. Click on **Save**.