---
title: "Multi Dimension Radar"
description: "A radar chart for visualizing values across two categorical dimensions, where one dimension represents the angular axis and the other represents series."
group: Charts
tags: [Visualization, Chart, Dashboard, Radar, Spider, Dimension, Multi-Dimension, Comparative Analysis]
---
import { Aside, Steps } from '@astrojs/starlight/components';
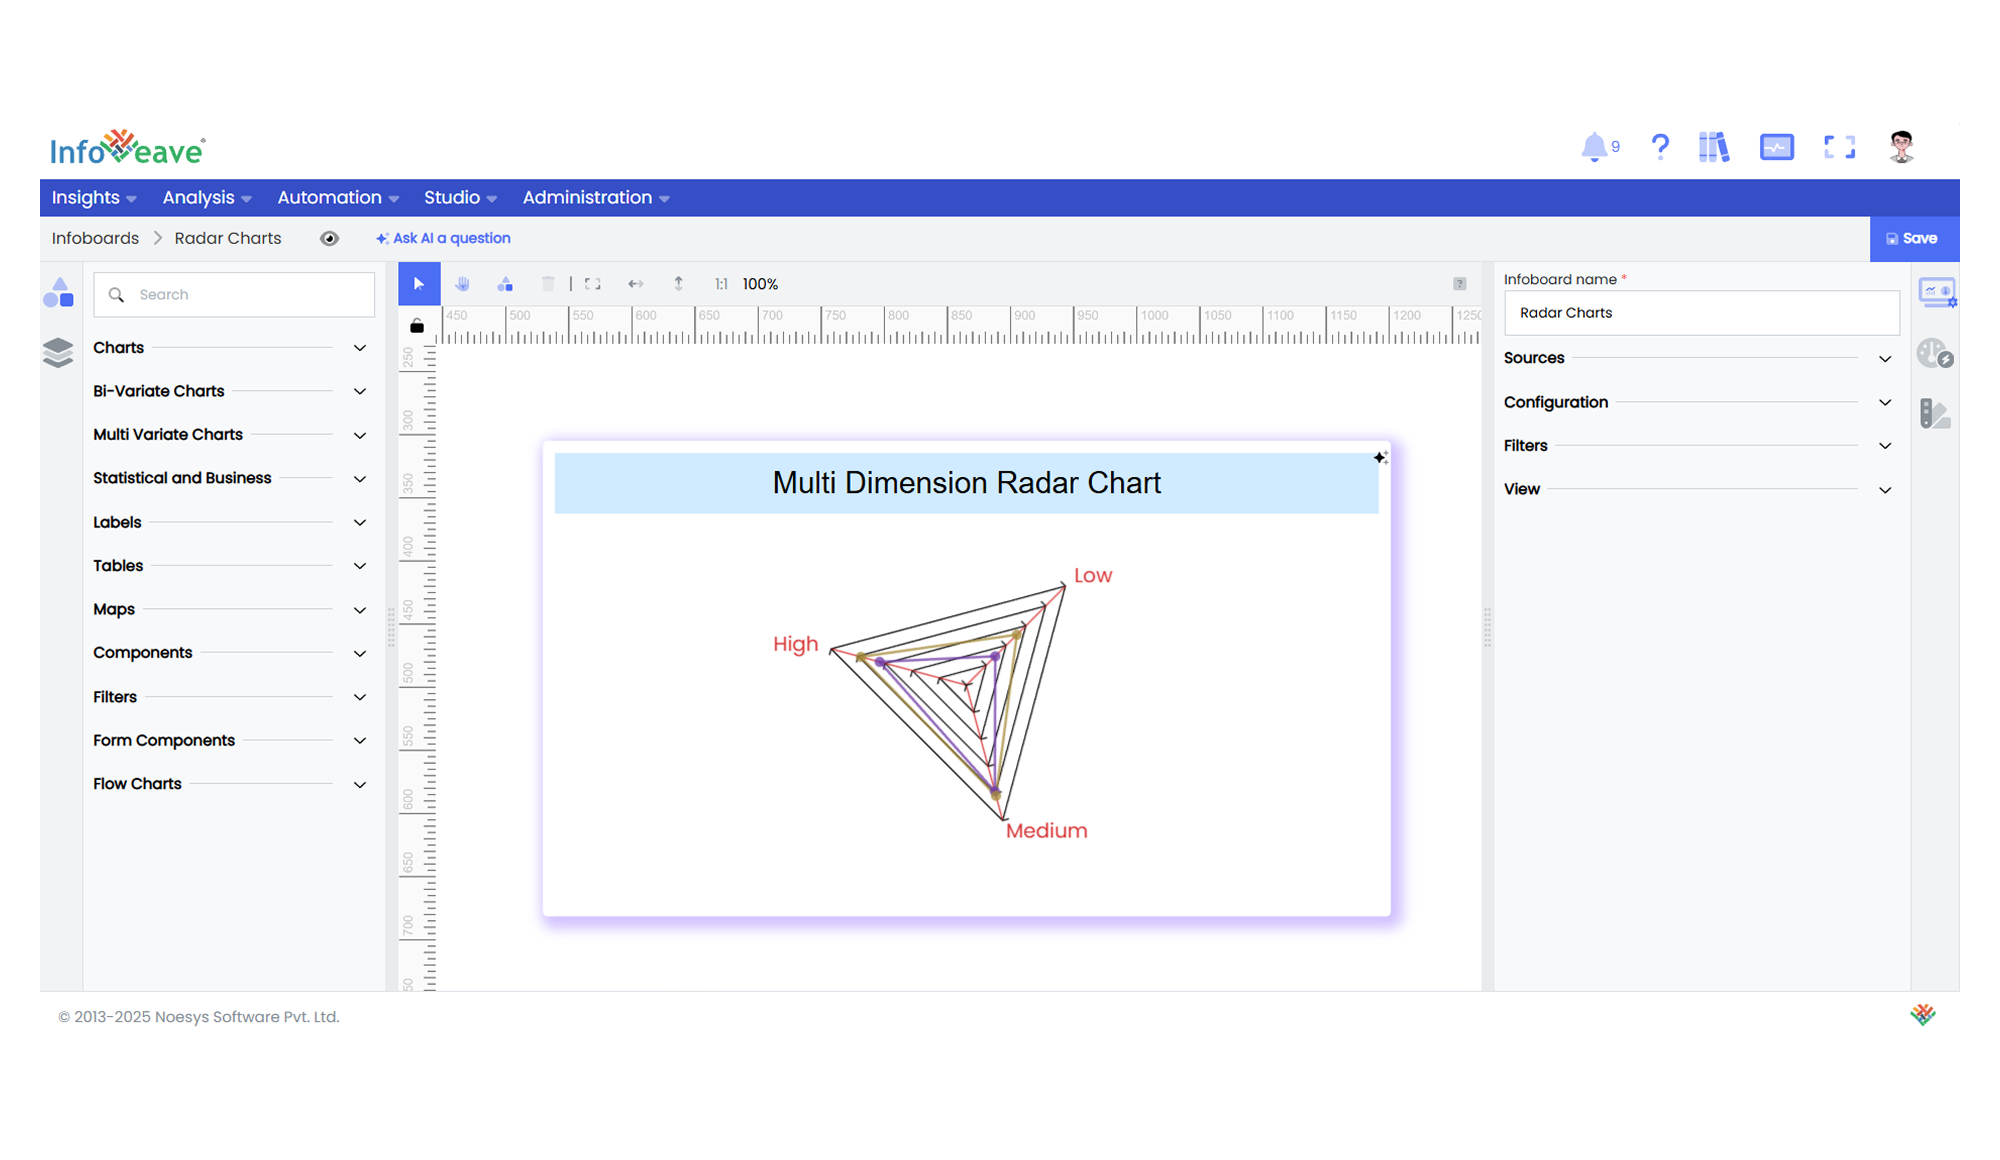
# Multi Dimension Radar
The **Multi Dimension Radar Chart** visualizes a single numeric measure distributed across two dimensions, with one dimension placed on the angular axis (radar indicators) and the other as individual series.
Each series plots its own values for all radar indicators, making it ideal for comparing categories (series) across multiple factors.
**Use cases:**
- Comparing multiple departments, regions, or teams (dimension 2) across performance metrics (dimension 1).
- Evaluating **category-wise scores across factors** like risk, opportunity, or performance.
- Detecting **outliers, gaps, or strong performers** across multiple groups in a comparative view.
---
## ⚙️ Setup
1. Drag the **Multi Dimension Radar Chart** widget from the chart library onto your designer workspace.
2. Select the chart.
3. Go to the [Widget Configuration](/insights-v8/guide-to-infoboard-designer/customize-panel/configure/) tab in the Configuration panel.
4. Under the Configuration panel tab, select the [Basic Configuration](/insights-v8/guide-to-infoboard-designer/customize-panel/configure/#basic) option to access essential settings for the Multi Dimension Radar Chart.
5. Select the [Source](/insights-v8/guide-to-infoboard-designer/customize-panel/setup/#sources) from which the chart will fetch its data.
6. Map:
- **[Measure](/studio-v8/datasources/measures-dimensions-and-hierarchies/)** — The numeric value to plot.
- **[Dimension1](/studio-v8/datasources/measures-dimensions-and-hierarchies/)** — Placed along the angular axis (radar indicators).
- **[Dimension2](/studio-v8/datasources/measures-dimensions-and-hierarchies/)** — Used to create individual series in the chart.
7. (Optional) Add a **Date** field for time-based filtering.
---
## 📊 Basic Configuration
| Configuration Item | Description |
|:---------------------|:-------------|
| **[Source](/insights-v8/guide-to-infoboard-designer/customize-panel/setup/#sources)** | The data source to query for chart values. |
| **[Measure](/studio-v8/datasources/measures-dimensions-and-hierarchies/)** | A single numeric value to display for each combination of Dimension1 and Dimension2. |
| **[Dimension1](/studio-v8/datasources/measures-dimensions-and-hierarchies/)** | Categorical values for the angular axis (radar indicators). |
| **[Dimension2](/studio-v8/datasources/measures-dimensions-and-hierarchies/)** | Categorical values to create multiple series (lines) in the radar chart. |
| **Date Field** (optional) | Enables date-based filtering and drilldown capability. |
---
## 🎨 Chart Customizations
| Category | Options & Description |
|:----------------------------|:-----------------------------------------------------------|
| **[General](/insights-v8/guide-to-infoboard-designer/customize-panel/customization-tab/#general)** | Theme, background, border, and interactivity options. |
| **[Title](/insights-v8/guide-to-infoboard-designer/customize-panel/customization-tab/#title)** | Chart title, font, alignment, and visibility settings. |
| **[Sorting](/insights-v8/guide-to-infoboard-designer/customize-panel/customization-tab/#sorting)** | Control sorting of dimension order. |
| **[Position](/insights-v8/guide-to-infoboard-designer/customize-panel/customization-tab/#position)** | Adjust horizontal and vertical positioning of the radar within the chart. |
| **[Radar](/insights-v8/guide-to-infoboard-designer/customize-panel/customization-tab/#categorical-axis)** | Configure radar indicators, grid shape, lines, and label styles. |
| **[Legend](/insights-v8/guide-to-infoboard-designer/customize-panel/customization-tab/#legends)** | Show/hide, position, and format for Dimension series legends. |
| **[Series](/insights-v8/guide-to-infoboard-designer/customize-panel/customization-tab/#series-customization)** | Customize symbol type, size, color, line color, line width, area fill, label positions, and formatting for each series. |
| **[Tooltip](/insights-v8/guide-to-infoboard-designer/customize-panel/customization-tab/#tooltip)** | Configure tooltip content, formatting, and triggers for value hover. |
| **Others** | Toggle overlapping label handling and configure whether null values should display as zero. |
---
## 📊 Example Visualization