---
title: "World Map Geo Json"
description: "A geographical map visualization rendering regions based on values from your dataset, using vector tile maps and GeoJSON layers. Offers advanced color, label, and interactive popup customization."
group: Charts
tags: [Visualization, Chart, Dashboard, Map, GeoJSON, Vector, Regional Analysis]
---
import { Aside, Steps } from '@astrojs/starlight/components';
# World Map Geo Json
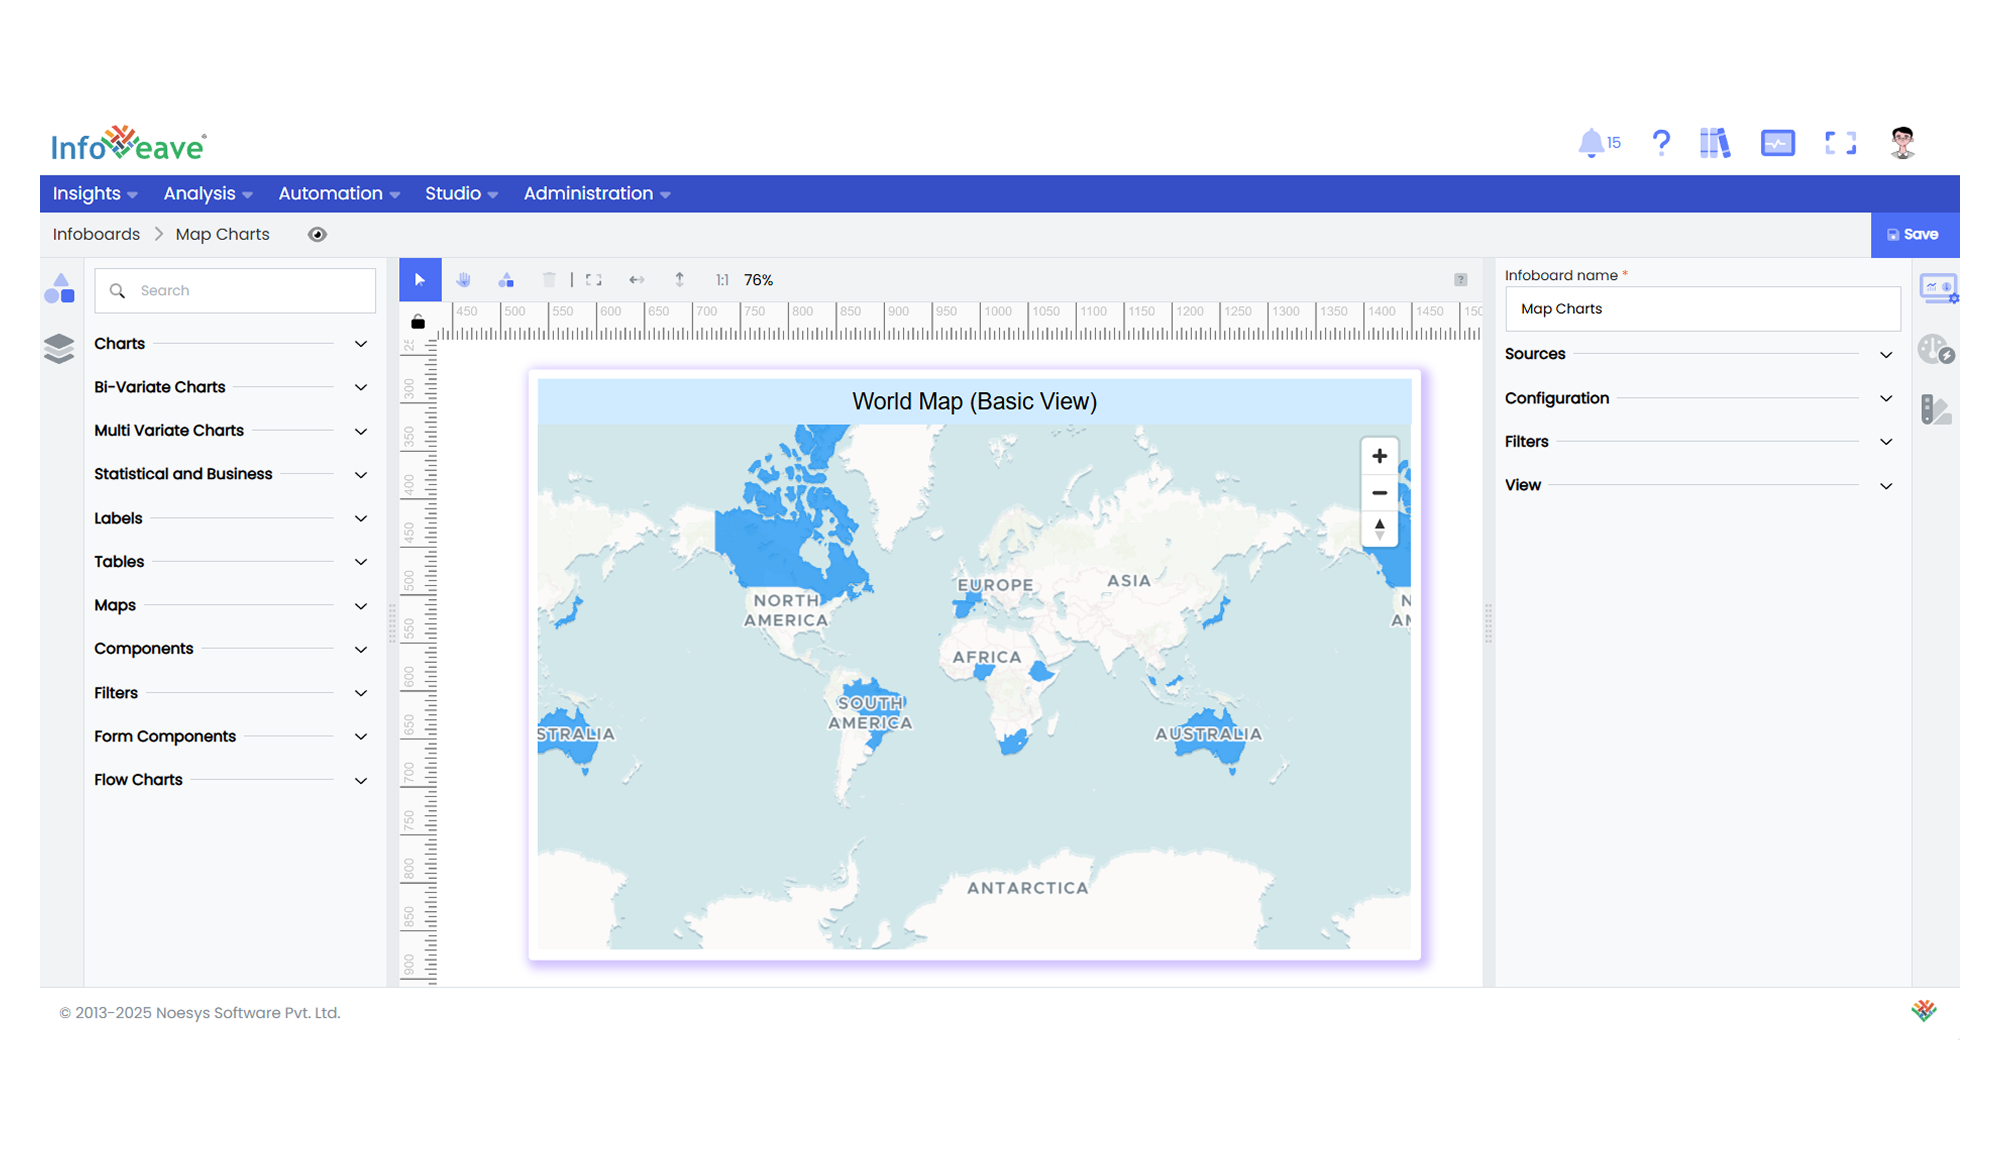
The **World Map GeoJSON Chart** displays values across a geographical map using a combination of **vector tile basemaps** and **GeoJSON data overlays**.
It colors each region based on corresponding numeric measures and offers label and tooltip popups positioned using geographic centroids.
**Use cases:**
- Visualizing **country-level or regional business performance**.
- Displaying **distribution of key metrics on a map background**.
- Interactive **geo drilldowns and region-specific popups**.
---
## ⚙️ Setup
1. Drag the **World Map GeoJSON Chart** widget from the chart library onto your designer workspace.
2. Select the chart.
3. Go to the [Widget Configuration](/insights-v8/guide-to-infoboard-designer/customize-panel/configure/) tab in the Configuration panel.
4. Under the Configuration panel tab, select the [Basic Configuration](/insights-v8/guide-to-infoboard-designer/customize-panel/configure/#basic) option to access essential settings for the World Map GeoJSON Chart.
5. Select the [Source](/insights-v8/guide-to-infoboard-designer/customize-panel/setup/#sources) from which the chart will fetch its data.
6. Map:
- **[Measures](/studio-v8/datasources/measures-dimensions-and-hierarchies/)** — One or more numeric measures controlling region fill and popup content.
- **[Dimension (Region)](/studio-v8/datasources/measures-dimensions-and-hierarchies/)** — Region label matching GeoJSON region names.
7. Optionally add a **Date** field for time-based filtering.
---
## 📊 Basic Configuration
| Configuration Item | Description |
|:---------------------|:-------------|
| **[Source](/insights-v8/guide-to-infoboard-designer/customize-panel/setup/#sources)** | The data source to query for chart values. |
| **[Measures](/studio-v8/datasources/measures-dimensions-and-hierarchies/)** | One or more numeric values determining region colors and popup values. |
| **[Dimension (Region)](/studio-v8/datasources/measures-dimensions-and-hierarchies/)** | Region label to match with GeoJSON region properties. |
| **Date Field** (optional) | Enables date-based filtering and drilldown capability. |
---
## 🎨 Chart Customizations
| Category | Options & Description |
|:----------------------------|:-----------------------------------------------------------|
| **[General](/insights-v8/guide-to-infoboard-designer/customize-panel/customization-tab/#general)** | Theme, background, and interactivity options. |
| **[Title](/insights-v8/guide-to-infoboard-designer/customize-panel/customization-tab/#title)** | Chart title, font, alignment, and visibility settings. |
| **[Sorting](/insights-v8/guide-to-infoboard-designer/customize-panel/customization-tab/#sorting)** | Define custom sort order for regions if needed. |
| **[Grid](/insights-v8/guide-to-infoboard-designer/customize-panel/customization-tab/#grid)** | Manage padding and chart layout alignment. |
| **[Series](/insights-v8/guide-to-infoboard-designer/customize-panel/customization-tab/#series-customization)** | Configure region fill colors (custom/automatic), label display, offset, font style, font size, and color. |
| **Map Options** | Select between various predefine maps, Configure blank color , map styles.
| **[Tooltip](/insights-v8/guide-to-infoboard-designer/customize-panel/customization-tab/#tooltip)** | Control popup content, font styling, and formatting on hover events. |
| **Others** | Set **GeoJSON Source**, **Map Style** (Blank, DataViz, Basic, Satellite), **No-Data Color**, and **Dimension Mapping (Region/ISO)**. |
---
## 📊 Example Visualization