---
title: "Parallel Axis"
description: "A chart used to visualize multivariate data using multiple axes where each axis represents a different variable, and each line represents a data record."
group: Charts
tags: [Visualization, Chart, Parallel Coordinates, Multivariate Analysis, ECharts]
---
import { Aside, Steps } from '@astrojs/starlight/components';
# Parallel Axis
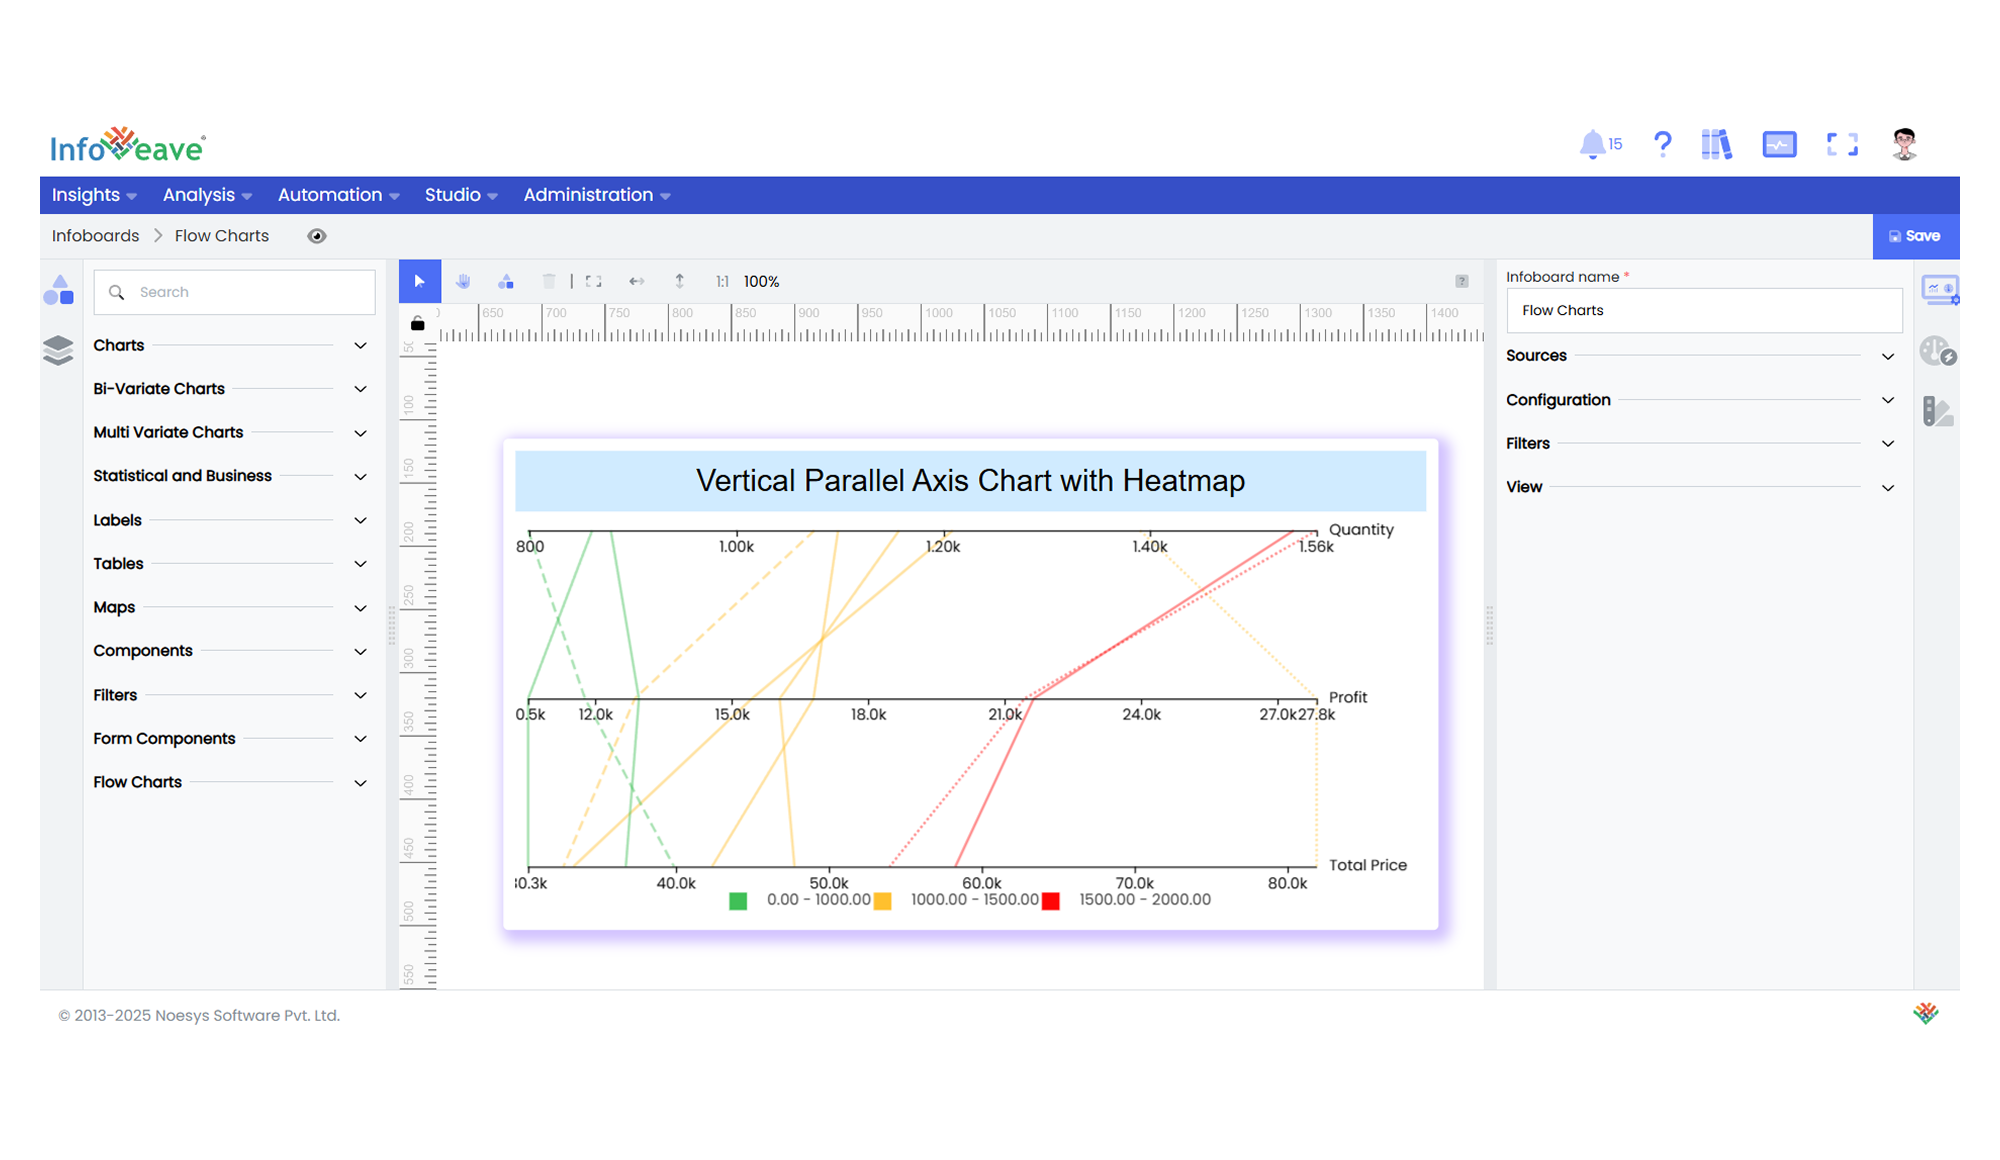
The **Parallel Axis Chart** (also known as a **Parallel Coordinates Plot**) displays multivariate data by plotting each variable on a separate parallel axis, connecting data points belonging to the same record with a line.
This chart is ideal for **comparing patterns across multiple variables simultaneously** or **finding clusters and outliers in multivariate datasets**.
**Use cases:**
- Multivariate performance comparison across multiple measures.
- Identifying trends, correlations, or outliers in high-dimensional data.
- Visualizing complex patterns in operational, financial, or research data.
---
## ⚙️ Setup
1. Drag the **Parallel Axis Chart** widget onto your designer workspace.
2. Select the chart.
3. Go to the [Widget Configuration](/insights-v8/guide-to-infoboard-designer/customize-panel/configure/) tab.
4. Under the Configuration panel tab, select the [Basic Configuration](/insights-v8/guide-to-infoboard-designer/customize-panel/configure/#basic) option.
5. Select your [Source](/insights-v8/guide-to-infoboard-designer/customize-panel/setup/#sources) for the chart.
6. Map:
- **[Measure](/studio-v8/datasources/measures-dimensions-and-hierarchies/)** — up to **10 measures** to display on parallel axes.
- **[Dimension](/studio-v8/datasources/measures-dimensions-and-hierarchies/)** — Name of the category or item to group the lines by.
7. Optionally add a **Date** field for time-based filtering.
---
## 📊 Basic Configuration
| Configuration Item | Description |
|:--------------------|:-------------|
| **[Source](/insights-v8/guide-to-infoboard-designer/customize-panel/setup/#sources)** | Data source to fetch the chart data from. |
| **[Measure](/studio-v8/datasources/measures-dimensions-and-hierarchies/)** | 2–10 numeric values, each displayed as a parallel axis. |
| **[Dimension](/studio-v8/datasources/measures-dimensions-and-hierarchies/)** | Category or label grouping each line on the chart. |
| **Date Field** (optional) | Enables date-based filtering and drilldown functionality. |
---
## 🎨 Chart Customizations
| Category | Options & Description |
|:----------------------------|:-----------------------------------------------------------|
| **[General](/insights-v8/guide-to-infoboard-designer/customize-panel/customization-tab/#general)** | Theme, interactivity, borders, and chart decals. |
| **[Title](/insights-v8/guide-to-infoboard-designer/customize-panel/customization-tab/#title)** | Chart title, font, alignment, and visibility options. |
| **[Sorting](/insights-v8/guide-to-infoboard-designer/customize-panel/customization-tab/#sorting)** | Sort order of data points by measure values or series name. |
| **[Grid](/insights-v8/guide-to-infoboard-designer/customize-panel/customization-tab/#grid)** | Control margins, padding, and positioning of the chart grid. |
| **[Legend](/insights-v8/guide-to-infoboard-designer/customize-panel/customization-tab/#legends)** | Show or hide legend and customize its appearance. |
| **[HeatMap](/insights-v8/guide-to-infoboard-designer/customize-panel/customization-tab/#heatmap)** | Optional color scale mapping to a selected measure. |
| **[Parallel Axis](/insights-v8/guide-to-infoboard-designer/customize-panel/customization-tab/#parallel-axis)** | Axis scaling, formatting, labels, and custom min/max ranges. |
| **[Series](/insights-v8/guide-to-infoboard-designer/customize-panel/customization-tab/#series-customization)** | Customize line appearance: smoothness, width, type, color, gradient fill, etc. |
| **[Tooltip](/insights-v8/guide-to-infoboard-designer/customize-panel/customization-tab/#tooltip)** | Enable and configure tooltips for individual points or lines. |
| **Others** | Layout orientation: **Horizontal** or **Vertical**. |
---
## 📊 Example Visualization