---
title: "Funnel"
description: "A visual representation of progressive stages in a process, typically showing decreasing values through a series of sequential steps."
group: Charts
tags: [Visualization, Chart, Dashboard, Funnel, Process, Conversion]
---
import { Aside, Steps } from '@astrojs/starlight/components';
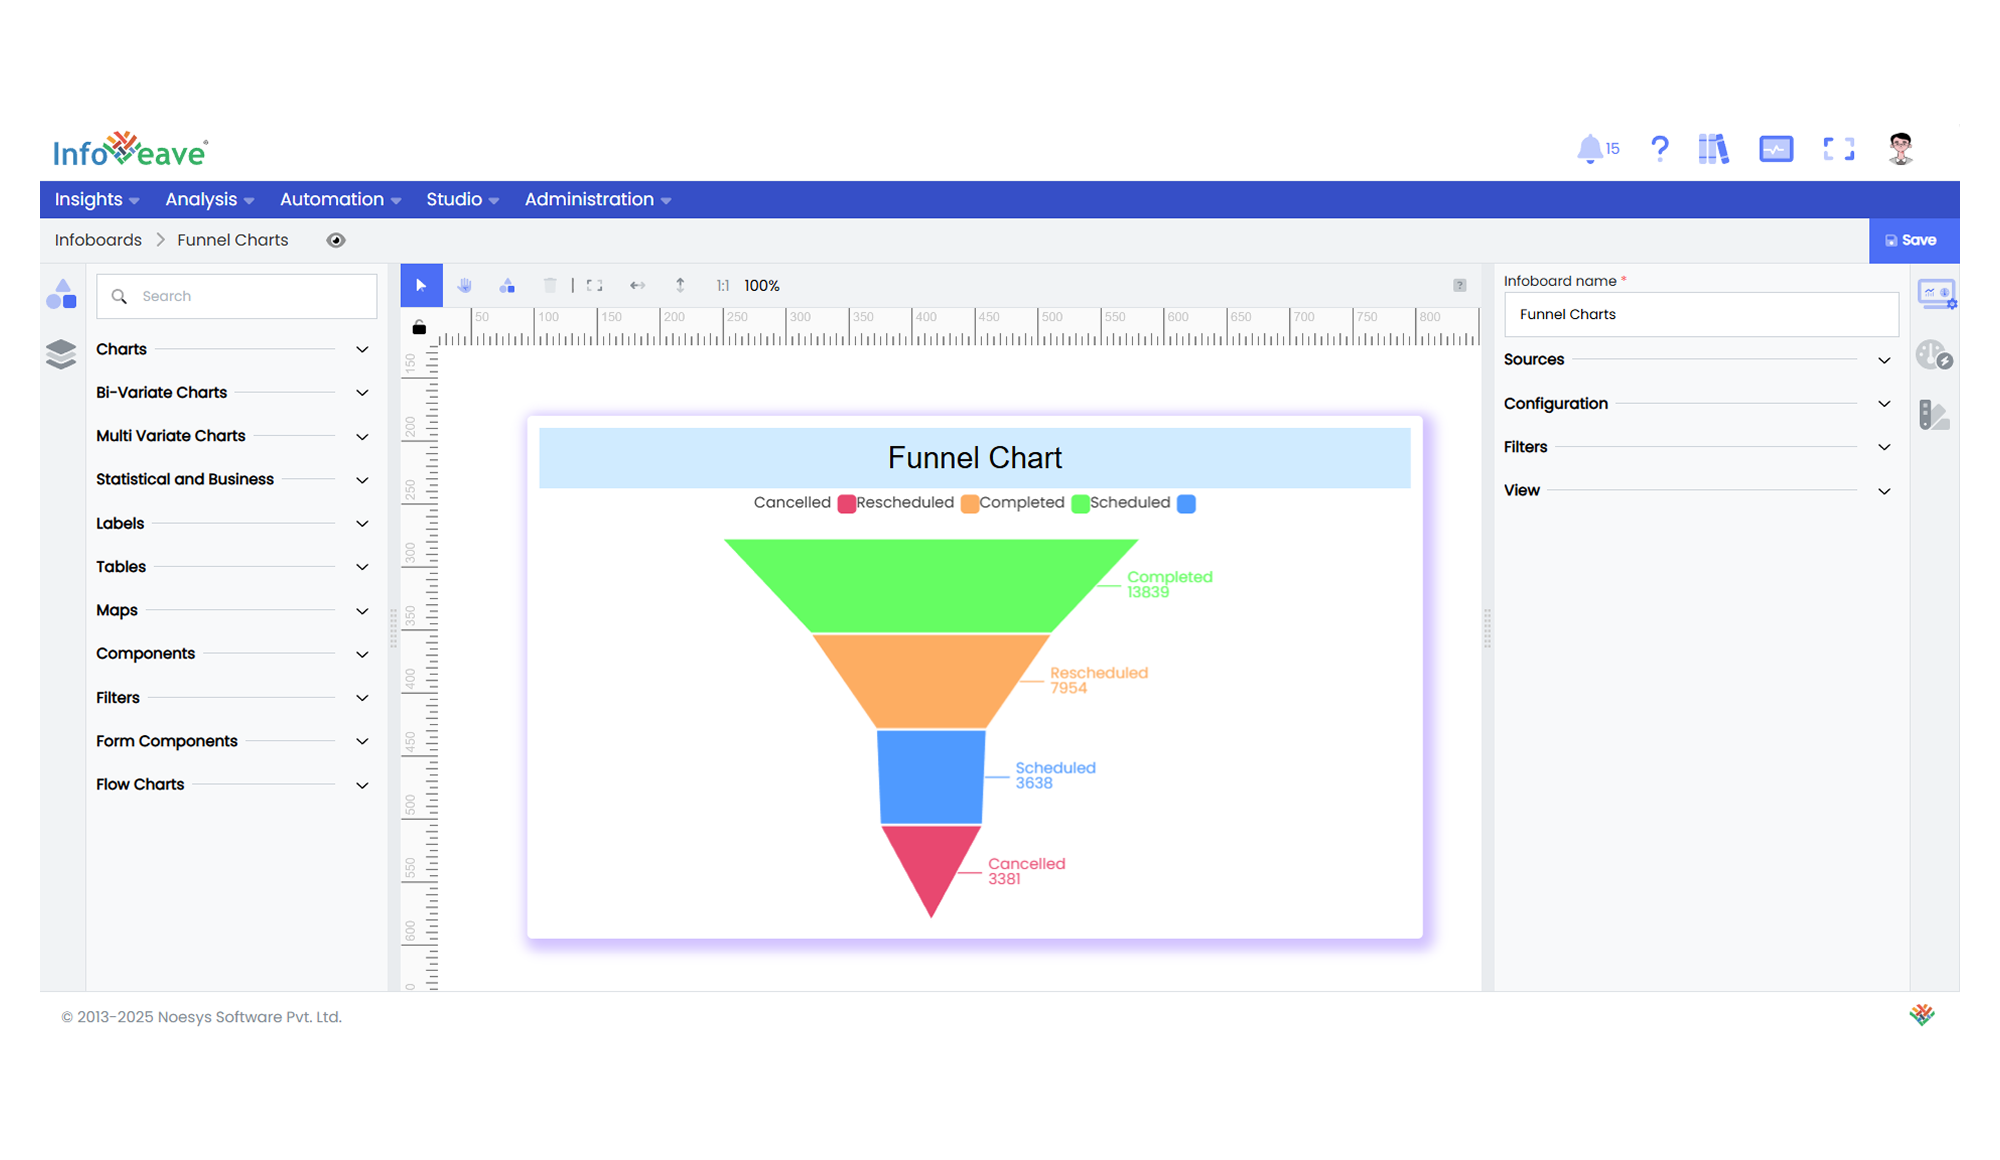
# Funnel
The **Funnel Chart** is ideal for displaying data that flows through sequential stages in a process.
It’s particularly useful for highlighting drop-off points between steps in a pipeline or illustrating conversion rates.
**Use cases:**
- **Sales pipeline conversions**
- **User registration steps**
- **Lead qualification processes**
- **Drop-off analysis at each stage of an onboarding journey**
---
## ⚙️ Setup
1. Drag the **Funnel Chart** widget from the chart library onto your designer workspace.
2. Select the chart.
3. Go to the [Widget Configuration](/insights-v8/guide-to-infoboard-designer/customize-panel/configure/) tab in the Configuration panel.
4. Under the Configuration panel tab, select the [Basic Configuration](/insights-v8/guide-to-infoboard-designer/customize-panel/configure/#basic) option to access essential settings for the chart.
5. Select the [Source](/insights-v8/guide-to-infoboard-designer/customize-panel/setup/#sources) from which the chart will fetch its data.
6. Map:
- **[Measure](/studio-v8/datasources/measures-dimensions-and-hierarchies/)** — Numeric value (e.g., number of leads, users, deals).
- **[Dimension](/studio-v8/datasources/measures-dimensions-and-hierarchies/)** — The category or step name in the funnel process.
---
## 📊 Basic Configuration
| Configuration Item | Description |
|:---------------------|:-------------|
| **[Source](/insights-v8/guide-to-infoboard-designer/customize-panel/setup/#sources)** | The data source to query for chart values. |
| **[Measure](/studio-v8/datasources/measures-dimensions-and-hierarchies/)** | Numeric value for each step in the funnel. |
| **[Dimension](/studio-v8/datasources/measures-dimensions-and-hierarchies/)** | The sequential stages of the funnel process. |
---
## 🎨 Chart Customizations
| Category | Options & Description |
|:----------------------------|:-----------------------------------------------------------|
| **[General](/insights-v8/guide-to-infoboard-designer/customize-panel/customization-tab/#general)** | Theme, background, animations, and accessibility options. |
| **[Title](/insights-v8/guide-to-infoboard-designer/customize-panel/customization-tab/#title)** | Chart title, font, alignment, and visibility settings. |
| **[Sorting](/insights-v8/guide-to-infoboard-designer/customize-panel/customization-tab/#sorting)** | Set funnel sorting order: ascending or descending. |
| **[Legend](/insights-v8/guide-to-infoboard-designer/customize-panel/customization-tab/#legends)** | Control legend visibility and position for the steps. |
| **[Series](/insights-v8/guide-to-infoboard-designer/customize-panel/customization-tab/#series-customization)** | Label visibility, position, overlap handling, colors (solid/gradient), and shadow styling. |
| **[Tooltip](/insights-v8/guide-to-infoboard-designer/customize-panel/customization-tab/#tooltip)** | Configure tooltip content, formatting, and triggers. |
| **Others** | Funnel-specific settings: gap size, top/bottom margin, width percentage, horizontal position, and value scaling method (Data, Total Sum, Custom). |
---
## 📊 Example Visualization