---
title: Measures and Dimensions
description: Learn how to use measures and dimensions for effective data analysis and visualization. Configure, define, and manage data easily.
---
import { Steps } from '@astrojs/starlight/components';
import { MediaPlayerComponent } from "../../../../../components/video-player";
import RunScript from "../../../../../components/RunScript.astro";
# Measures and Dimensions
Infoveave uses **Measures** (numerical data) and **Dimensions** (categorical attributes) to help you analyze and visualize data. Measures represent what you want to analyze. Dimensions provide context, and hierarchies help you organize data.
## Measures
Measures are numerical values that represent quantifiable data. These are typically the data points that you want to analyze, such as sales revenue, profit margins, or the number of products sold.
Infoveave allows you to create and aggregate measures to perform calculations like sum, average, minimum, maximum, and more.
Measures are usually displayed as numeric values in visualizations like charts and tables.
To define a measure, follow the steps below.
1. Open the required table in the **Datasource Designer**.
2. Select the column where you want to add a Measure.
3. Click on the ellipsis icon next to the column.
4. Select the option **Add measure** from the dropdown.
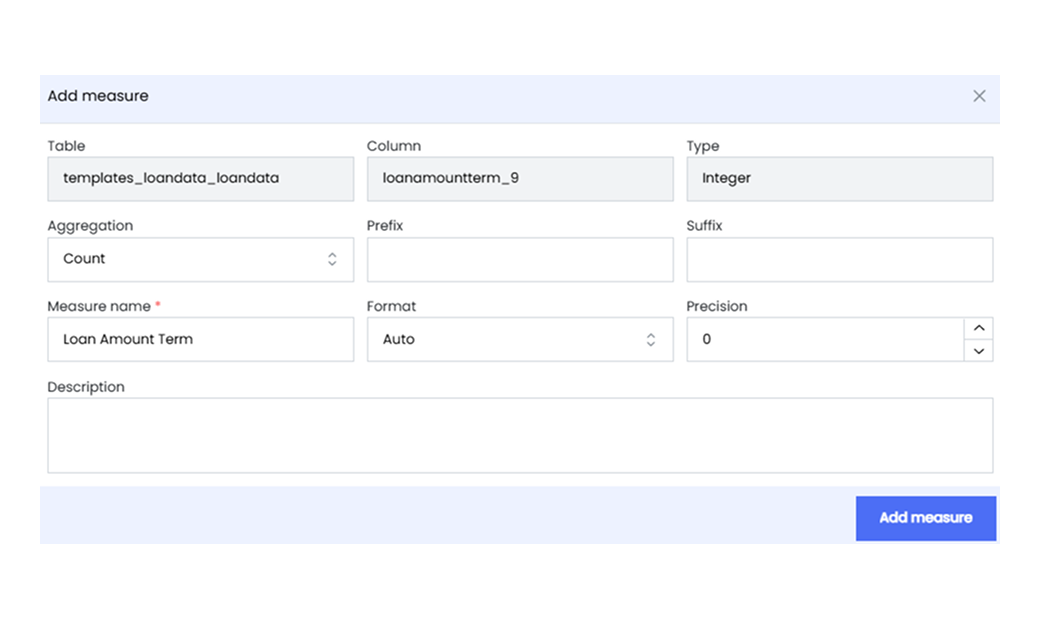
5. The **Add measure** modal window appears, allowing you to configure the measure.
* The **Table** and **Column** fields are predefined based on your selection.
* The **Type** field is also preselected, aligned with the data type of the chosen column.
6. One of the key components of the Add Measure modal is the **Aggregation** field. Here, you choose the desired aggregation function for the measure, which determines how values are summarized.
* **Count** The total count of values in the column.
* **Sum** The summation of numeric values.
* **Average** The mean value of numeric data.
* **DistinctCount** The count of distinct values.
* **Min** The minimum value in the column.
* **Max** The maximum value in the column.
7. Configure the properties of the measure to enhance its interpretability and relevance.
* **Prefix** A prefix to be added to measure values (optional).
* **Suffix** A suffix to be appended to measure values (optional).
* **Measure name** Provide a distinctive name for the measure.
* **Format** Define the desired display format for measure values.
* **Precision** Set the decimal precision for numeric values.
* **Description** Elaborate on the purpose and significance of the measure.
8. Click on the **Add measure** button to finalize the configuration.
9. The created measure becomes available under **Measures**.
## Dimensions
Dimensions are attributes or categories that help you organize and provide context to the data. These are non-numeric and typically include information like time, geography, product categories, or customer names.
In Infoveave, you use dimensions to slice and dice data, allowing you to filter and group data for more meaningful analysis.
Dimensions can be hierarchical, such as time with levels like year, quarter, month, and day.
To define a dimension, follow the steps below.
1. Open the required table in the **Datasource Designer**.
2. Select the column where you want to add a Dimension.
3. Click on the ellipsis icon next to the column.
4. Select the option **Add dimension** from the dropdown.
5. The Add Dimension modal window opens, allowing you to configure the properties of the dimension. The **Table**, **Column**, and **Type** fields are automatically populated based on your selection, which simplifies the configuration process.
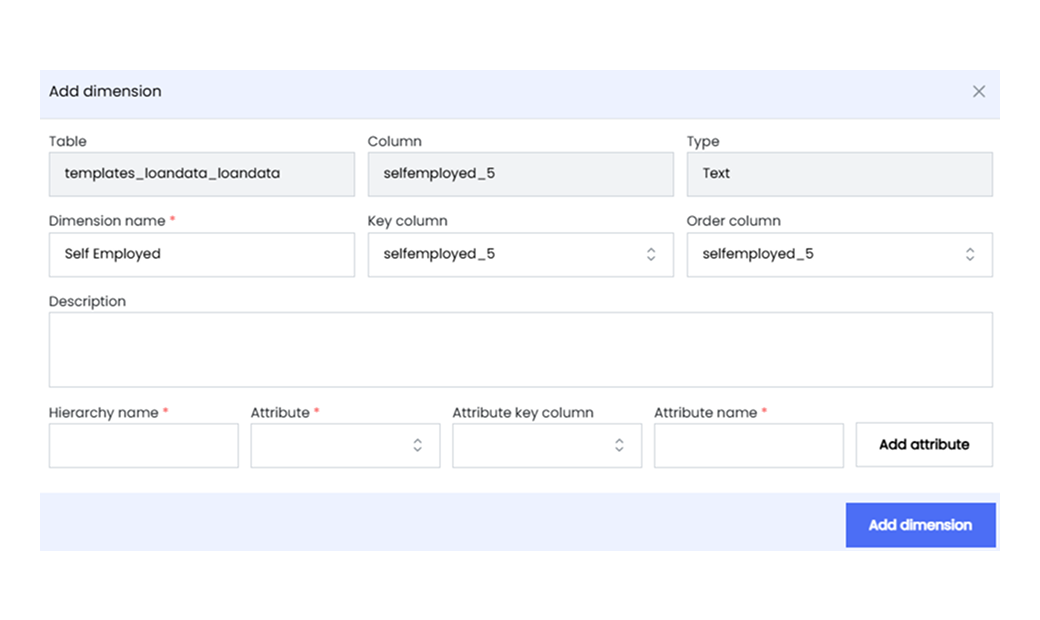
6. Configure the following essential fields for your dimension.
* **Dimension name** Provide a descriptive name for the dimension to distinguish it from others.
* **Key column** Choose the column that contains unique values acting as key identifiers for this dimension. These identifiers enable proper linking and referencing of data across different tables.
* **Order column** Optionally specify an order for the values within the dimension.
* **Description** Elaborate on the purpose and significance of the dimension.
7. If you want to define a hierarchy within the dimension or establish relationships between tables, you can specify the following.
* **Hierarchy name** Define a hierarchy name to organize and structure the dimension.
* **Attribute** An attribute represents a specific element or characteristic within a dimension that contributes to its hierarchy. Define the attribute that you want to include in your hierarchy. This could be a subcategory, subgroup, or any other relevant classification within the dimension.
* **Attribute key column** For each attribute included in the hierarchy, you need to specify a key column that serves as a link to the related data. This key column provides a reference point for navigating and organizing data within the hierarchy.
* **Attribute name** Specify the attribute’s display name.
8. Click on **Add attribute** to add the hierarchy.
9. Click on the **Add dimension** button to finalize the configuration of the dimension.