---
title: "Area"
description: "A line-based chart visualization where the area beneath the line is filled with color to emphasize volume, trends, and comparative insights."
group: Charts
tags: [Visualization, Chart, Dashboard, Area, Trend, Comparative Analysis]
---
import { Aside, Steps } from '@astrojs/starlight/components';
# Area
The **Area Chart** is a variation of the line chart where the area between the line and the axis is filled with color or shading.
It helps visualize trends over time or categories while emphasizing the magnitude of values.
Like Line charts, it supports both **Horizontal (Category X, Value Y)** and **Vertical (Value X, Category Y)** orientations.
**Use cases:**
- Displaying **cumulative values over time**.
- Visualizing **contributions of multiple categories** to a whole.
- Highlighting **volume changes and peaks** within a data series.
---
## ⚙️ Setup
1. Drag the **Area Chart** widget from the chart library onto your designer workspace.
2. Select the chart.
3. Go to the [Widget Configuration](/insights-v8/guide-to-infoboard-designer/customize-panel/configure/) tab in the Configuration panel.
4. Under the Configuration panel tab, select the [Basic Configuration](/insights-v8/guide-to-infoboard-designer/customize-panel/configure/#basic) option to access essential settings for the Area Chart.
5. Select the [Source](/insights-v8/guide-to-infoboard-designer/customize-panel/setup/#sources) from which the chart will fetch its data.
6. Map:
- **[Measure (Value)](/studio-v8/datasources/measures-dimensions-and-hierarchies/)** — Numeric value representing the Y (or X) axis value.
- **[Dimension (Axis)](/studio-v8/datasources/measures-dimensions-and-hierarchies/)** — Categorical or sequential value for the primary axis labels.
- **[Group](/studio-v8/datasources/measures-dimensions-and-hierarchies/)** — (Optional) Categorical value to split the area series.
7. Optionally add a **Date** field for time-based filtering.
---
## 📊 Basic Configuration
| Configuration Item | Description |
|:---------------------|:-------------|
| **[Source](/insights-v8/guide-to-infoboard-designer/customize-panel/setup/#sources)** | The data source to query for chart values. |
| **[Measure (Value)](/studio-v8/datasources/measures-dimensions-and-hierarchies/)** | Numeric value plotted along the Y (or X if vertical) axis. |
| **[Dimension (Axis)](/studio-v8/datasources/measures-dimensions-and-hierarchies/)** | Categorical or sequential value for primary axis labels. |
| **[Group](/studio-v8/datasources/measures-dimensions-and-hierarchies/)** | (Optional) Grouping field to split the area lines into multiple series. |
| **Date Field** (optional) | Enables date-based filtering and drilldown capability. |
---
## 🎨 Chart Customizations
| Category | Options & Description |
|:----------------------------|:-----------------------------------------------------------|
| **[General](/insights-v8/guide-to-infoboard-designer/customize-panel/customization-tab/#general)** | Theme, background, border, and interactivity options. |
| **[Title](/insights-v8/guide-to-infoboard-designer/customize-panel/customization-tab/#title)** | Chart title, font, alignment, and visibility settings. |
| **[Sorting](/insights-v8/guide-to-infoboard-designer/customize-panel/customization-tab/#sorting)** | Control sorting of categories or series order. |
| **[Grid](/insights-v8/guide-to-infoboard-designer/customize-panel/customization-tab/#grid)** | Manage padding and chart grid layout. |
| **[Legend](/insights-v8/guide-to-infoboard-designer/customize-panel/customization-tab/#legends)** | Show/hide, position, and format for series legends. |
| **[HeatMap](/insights-v8/guide-to-infoboard-designer/customize-panel/customization-tab/#heatmap)** | Apply color gradients based on value ranges. |
| **[Categorical Axis](/insights-v8/guide-to-infoboard-designer/customize-panel/customization-tab/#categorical-axis)** | Customize category axis labels, rotation, and intervals. |
| **[Numerical Axis](/insights-v8/guide-to-infoboard-designer/customize-panel/customization-tab/#numerical-axis)** | Adjust value axis scale, formatting, and log scale. |
| **[Series](/insights-v8/guide-to-infoboard-designer/customize-panel/customization-tab/#series-customization)** | Control fill color, border color, symbols, smoothing, and data labels for the area lines. |
| **[Tooltip](/insights-v8/guide-to-infoboard-designer/customize-panel/customization-tab/#tooltip)** | Tooltip content, format, and triggers. |
| **Others** | Set **Orientation** between `Horizontal` (Category X, Value Y) and `Vertical` (Value X, Category Y). |
---
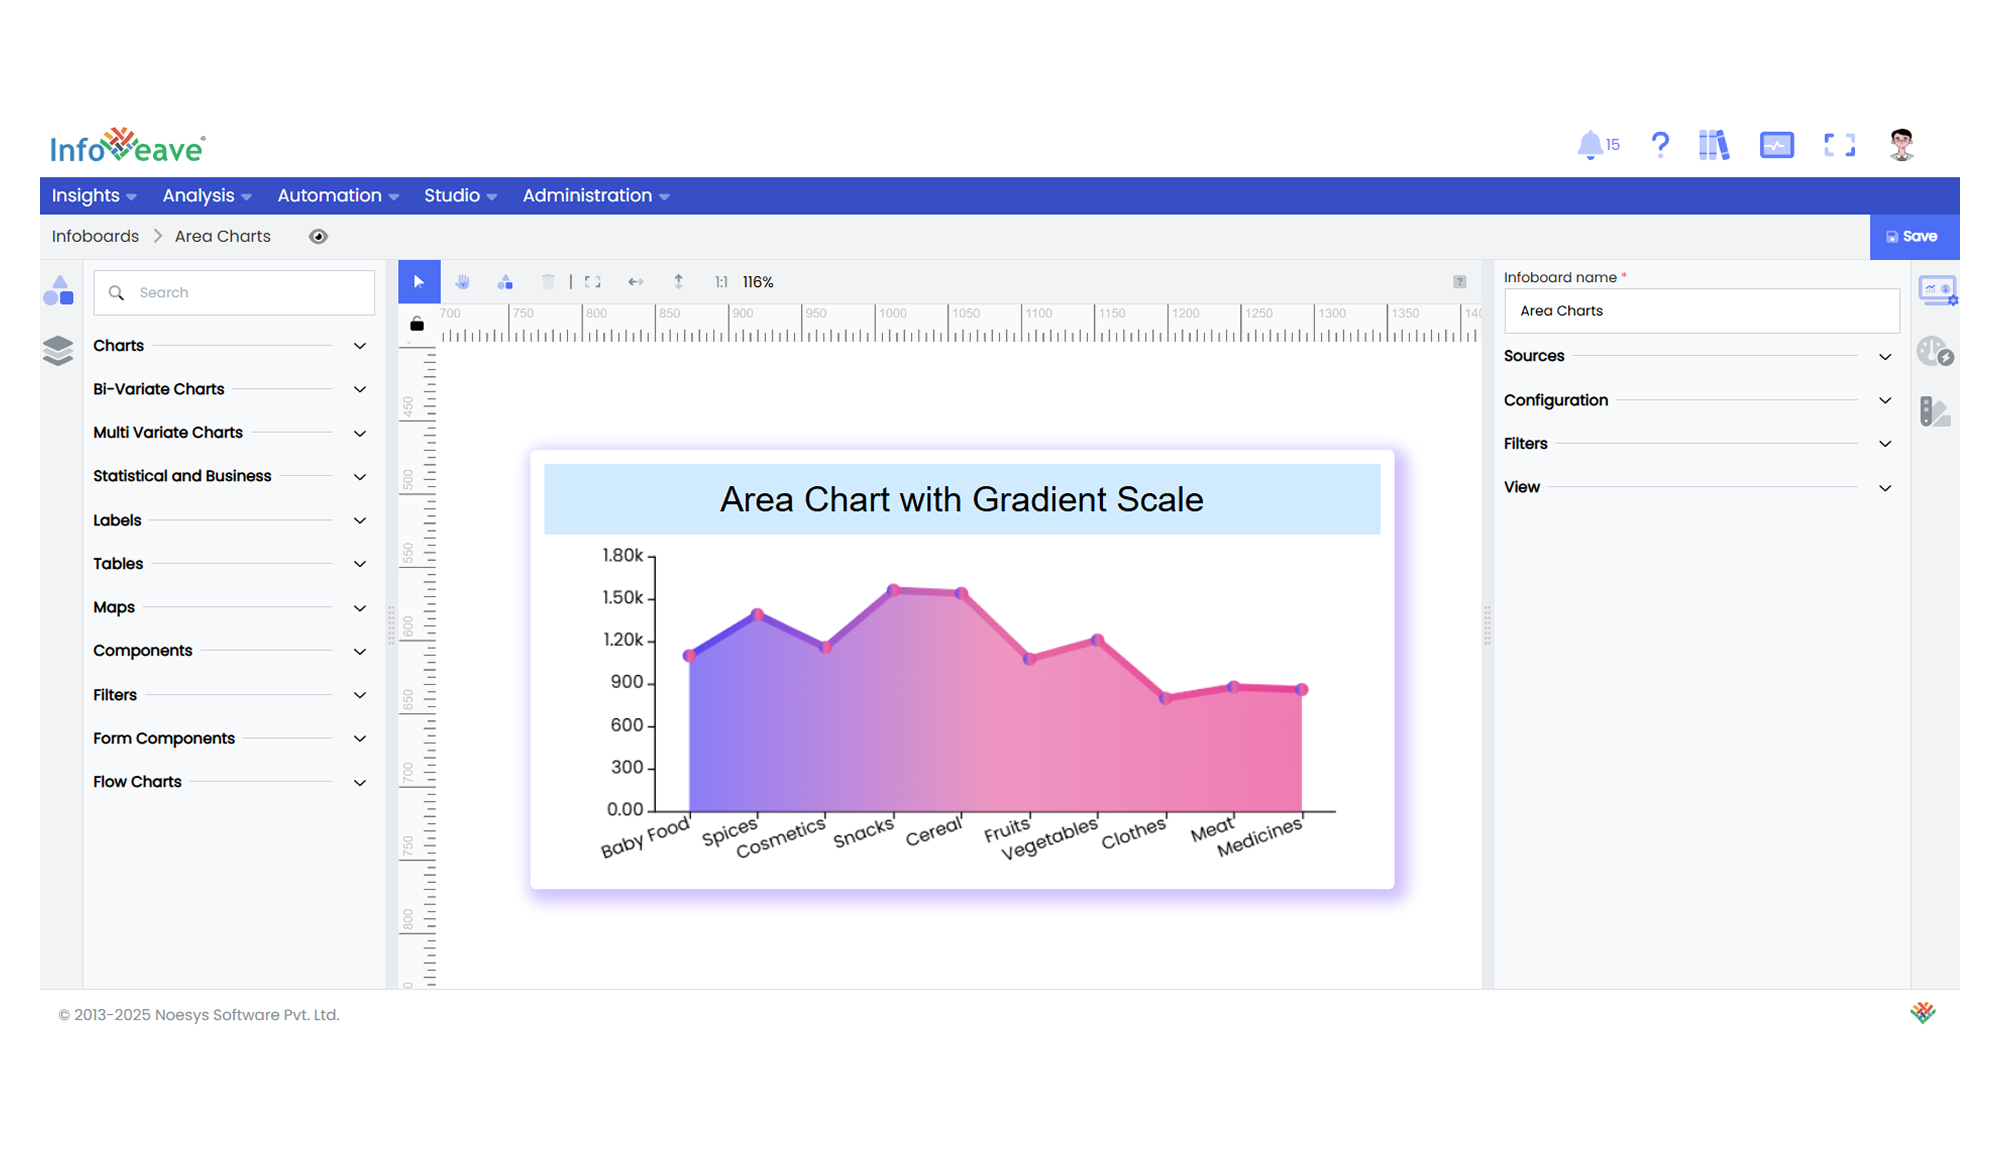
## 📊 Example Visualization