---
title: "Circular Gauge"
description: "A radial gauge visualization for representing one or multiple numeric KPIs with concentric arcs, fill ranges, and value indicators."
group: Charts
tags: [Visualization, Chart, Dashboard, Insights, KPI, Gauge]
---
import { Aside, Steps } from '@astrojs/starlight/components';
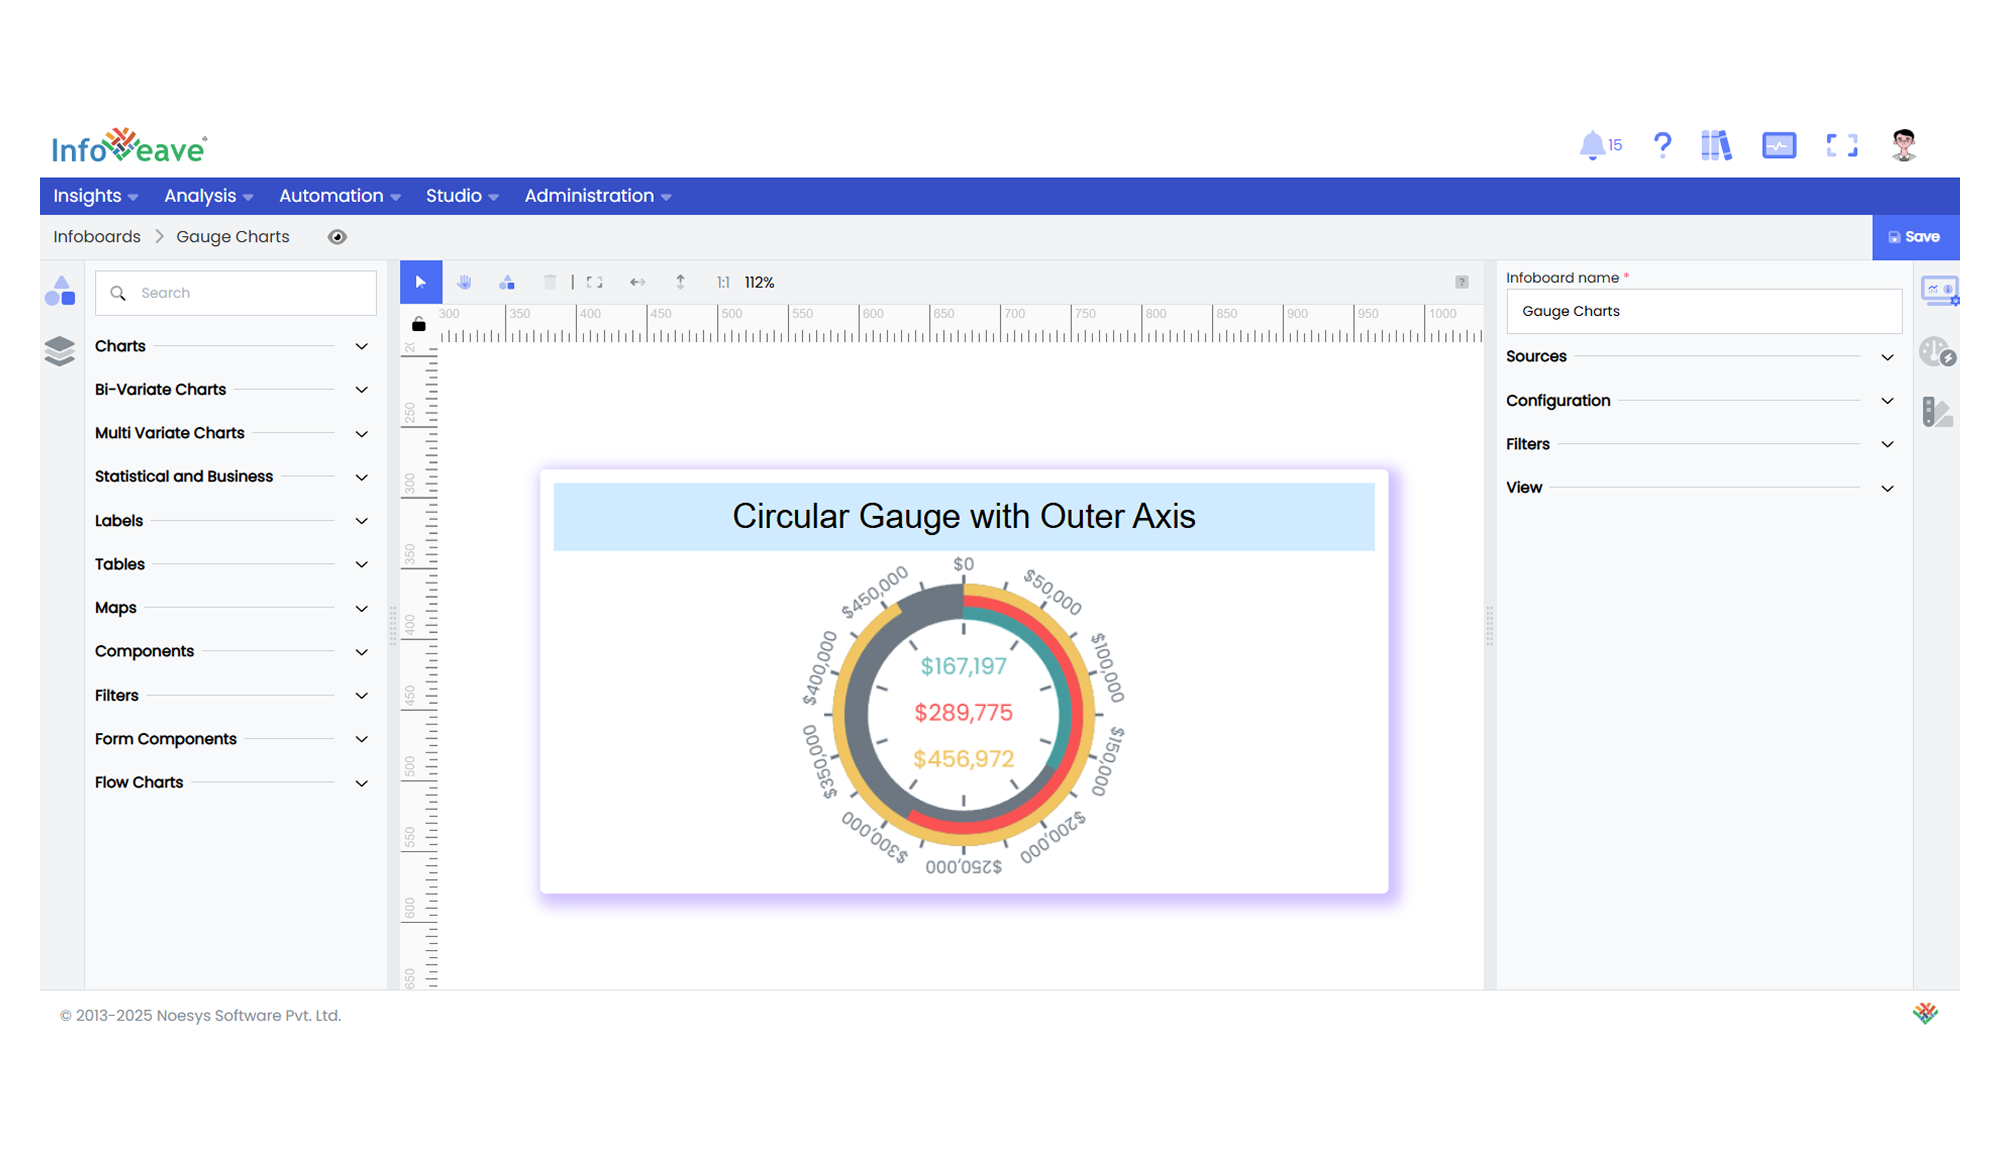
# Circular Gauge
The **Circular Gauge Chart** is a dialless radial visualization designed to display one or multiple key numeric metrics as concentric progress arcs or rings. Each arc represents a measure’s value relative to its defined minimum and maximum, offering a quick, at-a-glance indication of performance or progress.
Unlike classic gauges with pointers or needles, this chart uses a **filled radial arc** or progress segment that visually encodes the current value as a proportion of its total range. Multiple measures can be displayed simultaneously as stacked or concentric arcs within a single gauge frame.
Circular Gauges are especially effective for tracking **target-based KPIs**, completion percentages, or real-time operational metrics on executive dashboards.
**Key Features:**
- Displays current value against a defined min/max as a filled progress arc.
- Supports multiple concentric arcs for comparing several KPIs in one visual.
- Allows customizable ranges, scale ticks, value labels, and color gradients.
- Ideal for real-time dashboards, scorecards, and progress tracking.
**Typical use cases:**
- Showing **sales achievement %** against monthly or quarterly targets.
- Monitoring **system uptime** or SLA adherence.
- Visualizing **budget vs. utilization** rates.
- Displaying **order fulfillment progress**.
- Representing **metric completions** for operational KPIs.
---
## ⚙️ Setup
1. Drag the **Circular Gauge Chart** widget from the chart library onto your designer workspace.
2. Select the chart.
3. Go to the [Widget Configuration](/insights-v8/guide-to-infoboard-designer/customize-panel/configure/) tab in the Customize panel.
4. Under the Configuration tab, select the [Basic Configuration](/insights-v8/guide-to-infoboard-designer/customize-panel/configure/#basic) option to access the essential settings for the circular gauge chart.
5. Select the [Source](/insights-v8/guide-to-infoboard-designer/customize-panel/setup/#sources) which the chart will pull the data from the option.
6. Map:
- **[Measure (Value)](/studio-v8/datasources/measures-dimensions-and-hierarchies/)** — One or more numeric KPIs you want to visualize.
7. Optionally add a **Date** field for time-based filtering.
8. Enable **Hide Zero Values** to omit symbols with zero values if needed.
---
## 📊 Basic Configuration
| Configuration Item | Description |
|:---------------------------------------|:----------------------------------------------------------|
| **[Source](/insights-v8/guide-to-infoboard-designer/customize-panel/setup/#sources)** | Source providing the data for measures and dimensions. |
| **[Measure](/studio-v8/datasources/measures-dimensions-and-hierarchies/)** | One or more numeric values to visualize as radial progress arcs. |
| **Date Field** (optional) | Date dimension for time-based analysis or filtering. |
---
## 🎨 Chart Customizations
| Category | Options & Description |
|:----------------------------|:-----------------------------------------------------------|
| **[General](/insights-v8/guide-to-infoboard-designer/customize-panel/customization-tab/#general)** | Modify the chart’s general appearance, including the background color, borders, shadows, and drill-out choices.
| **[Title](/insights-v8/guide-to-infoboard-designer/customize-panel/customization-tab/#title)** | Enable and customize chart title text, alignment, font, and color. |
| **[Tooltip](/insights-v8/guide-to-infoboard-designer/customize-panel/customization-tab/#tooltip)** | Control tooltip content, formatting, and visibility on hover. |
| **[Position](/insights-v8/guide-to-infoboard-designer/customize-panel/customization-tab/#position)** | Set horizontal and vertical alignment of the gauge within the chart canvas. |
| **[Series](/insights-v8/guide-to-infoboard-designer/customize-panel/customization-tab/#series-customization)** | Style symbols: adjust size ranges, enable stacking, toggle labels, and set symbol offset for multiple series. |
| **Styles** | Control arc fill style, value labels, arc borders, and background transparency. |
| **Others** | Adjust animation behavior, clockwise direction, and gauge radius. |
---
## 📊 Example Visualization