---
title: "Map Svg"
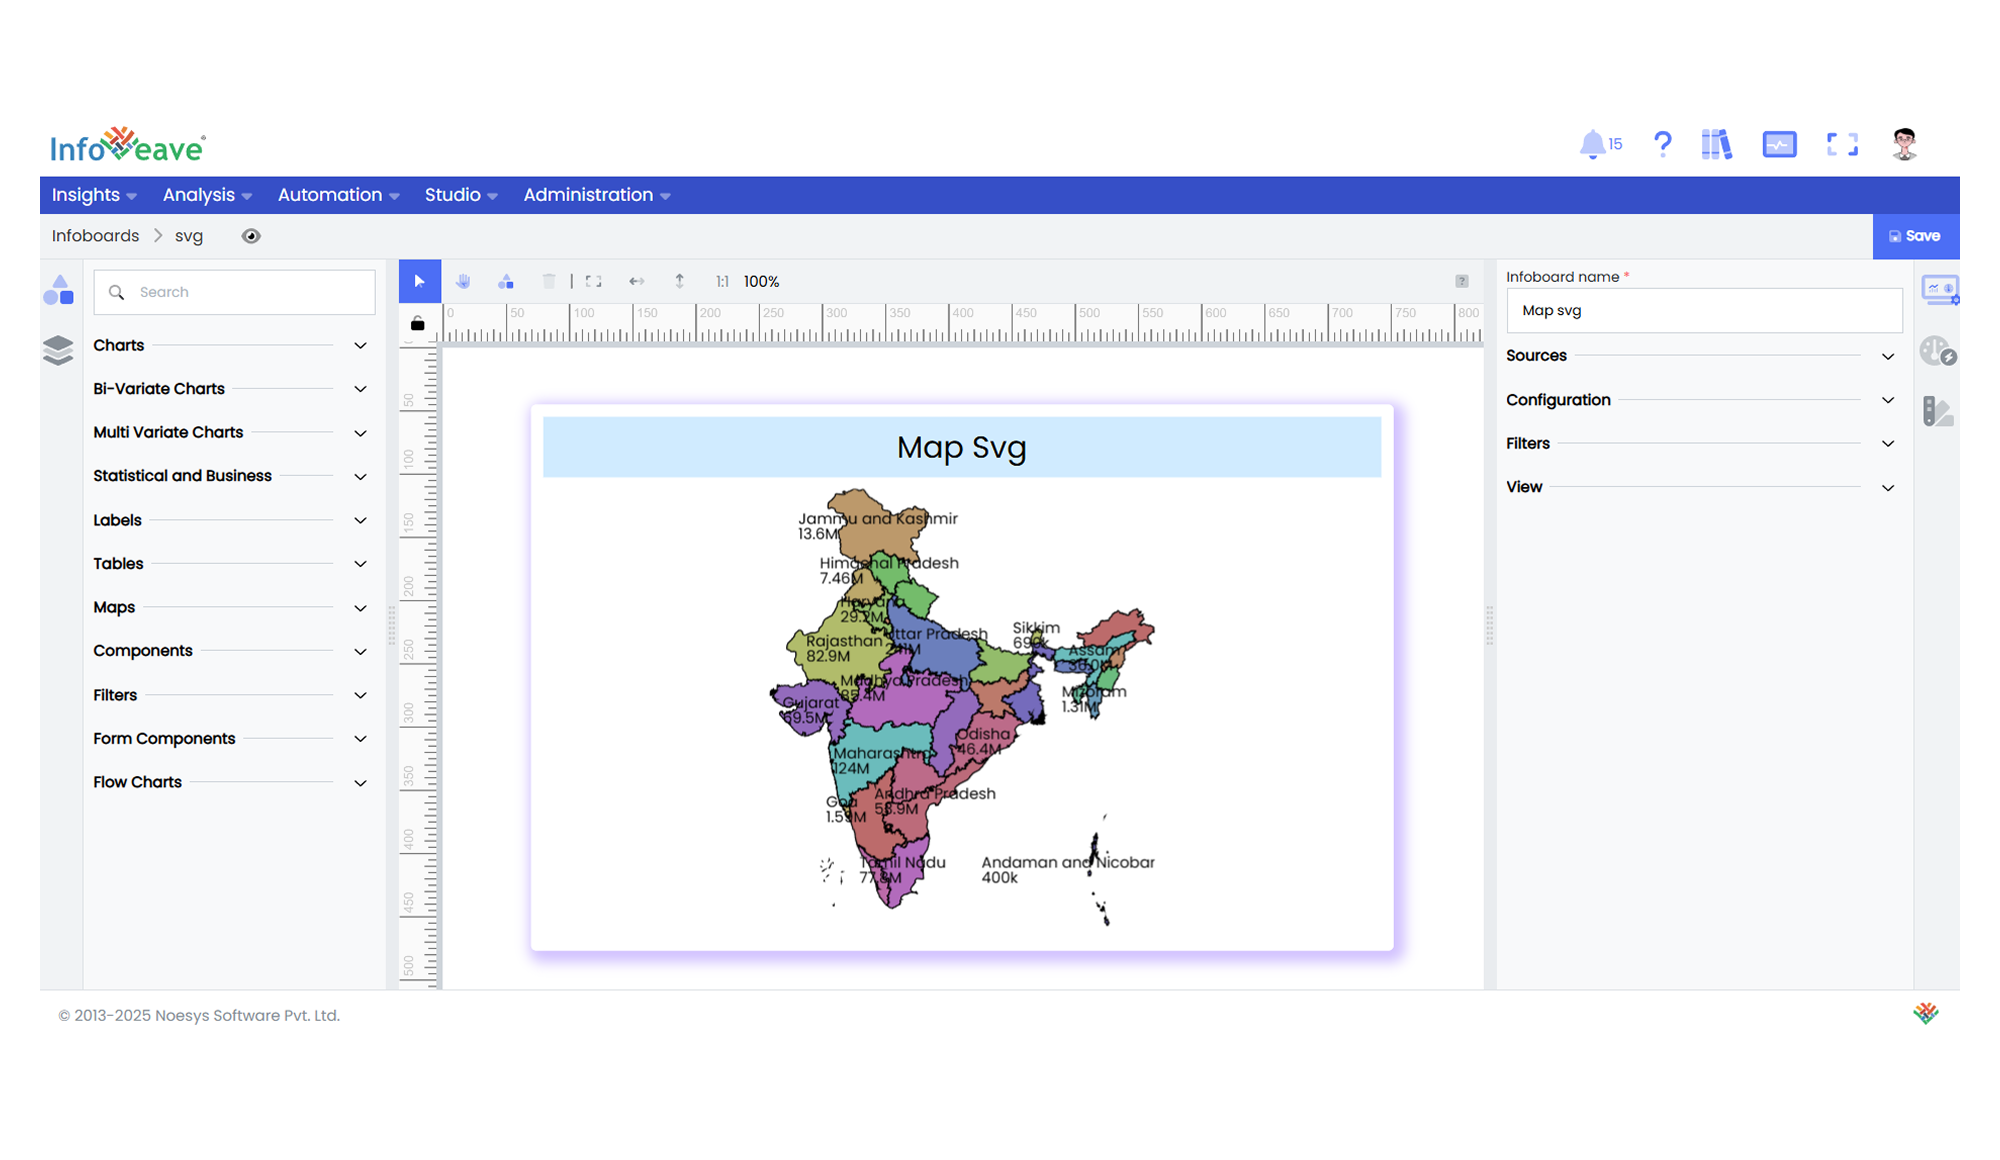
description: "A map chart visualization using custom SVG shapes with color-coded data, heatmaps, and interactive drilldowns."
group: Charts
tags: [Visualization, Map, SVG, Heatmap, Geographical, Custom Map]
---
import { Aside, Steps } from '@astrojs/starlight/components';
# Map Svg
The **SVG Map Chart** is a data visualization component that maps data values onto custom SVG-based maps. It supports heatmaps, tooltips, drilldowns, and flexible positioning and scaling of the SVG map within the chart area. Ideal for visualizing geospatial, regional, or shape-based data representations.
**Key Features:**
- Visualizes numeric data over **custom SVG maps**.
- Supports **heatmap color scaling** via ECharts VisualMap.
- Interactive **tooltip** display with customizable formatting.
- Configurable **SVG size**, **positioning**, and map names.
- Performance-optimized rendering with optional animations.
**Use Cases:**
- Regional sales performance.
- Custom geographical maps (district, zone, territory).
- Visualizing supply chain networks or logistics regions.
- Any non-geographical shape-based data mapping.
---
## ⚙️ Setup
1. Drag the **Map SVG Chart** widget from the chart library onto your designer workspace.
2. Select the chart.
3. Go to the [Widget Configuration](/insights-v8/guide-to-infoboard-designer/customize-panel/configure/) tab in the Customize panel.
4. Under the Configuration tab, select the [Basic Configuration](/insights-v8/guide-to-infoboard-designer/customize-panel/configure/#basic) option to access the essential settings for the map svg chart.
5. Select the [Source](/insights-v8/guide-to-infoboard-designer/customize-panel/setup/#sources) which the chart will pull the data from the option.
6. Map:
- **[Measure](/studio-v8/datasources/measures-dimensions-and-hierarchies/)** — Numerical value determining symbol size.
- **[Dimension](/studio-v8/datasources/measures-dimensions-and-hierarchies/)** — Categorical field for horizontal grouping.
7. Optionally add a **Date** field for time-based filtering.
8. Enable **Hide Zero Values** to omit symbols with zero values if needed.
---
## 📊 Basic Configuration
| Configuration Item | Description |
|:------------------|:------------------------------------------------|
| **[Source](/insights-v8/guide-to-infoboard-designer/customize-panel/setup/#sources)** | Source providing the data for measures and dimensions. |
| **[Measure](/studio-v8/datasources/measures-dimensions-and-hierarchies/)** | Numeric value to visualize per region/shape. |
| **[Dimension](/studio-v8/datasources/measures-dimensions-and-hierarchies/)** | Name of the region/shape in the SVG file. |
---
## 🎨 Chart Customizations
| Category | Options & Description |
|:------------|:------------------------------------------------|
| **[General](/insights-v8/guide-to-infoboard-designer/customize-panel/customization-tab/#general)** | Modify the chart’s general appearance, including the background color, borders, shadows, and drill-out choices.
| **[Title](/insights-v8/guide-to-infoboard-designer/customize-panel/customization-tab/#title)** | Enable and customize chart title text, alignment, font, and color. |
| **[HeatMap](/insights-v8/guide-to-infoboard-designer/customize-panel/customization-tab/#heatmap)** | Configure a visual color map to represent value intensity with a gradient. |
| **[Position](/insights-v8/guide-to-infoboard-designer/customize-panel/customization-tab/#position)** | Horizontal and vertical alignment. |
| **[Series](/insights-v8/guide-to-infoboard-designer/customize-panel/customization-tab/#series-customization)** | Label visibility, overlap settings, and color behaviors. |
| **[Tooltip](/insights-v8/guide-to-infoboard-designer/customize-panel/customization-tab/#tooltip)** | Tooltip content, formatting, and styling. |
| **Others** | Map name selection and map size percentage. |
---
## 📊 Example Visualization