---
title: "Waterfall"
description: "Visualize incremental positive and negative changes across a sequence leading to a cumulative total."
group: Charts
tags: [Visualization, Chart, Dashboard, Financial Analysis, Sequential Change]
---
import { Aside, Steps } from '@astrojs/starlight/components';
# Waterfall
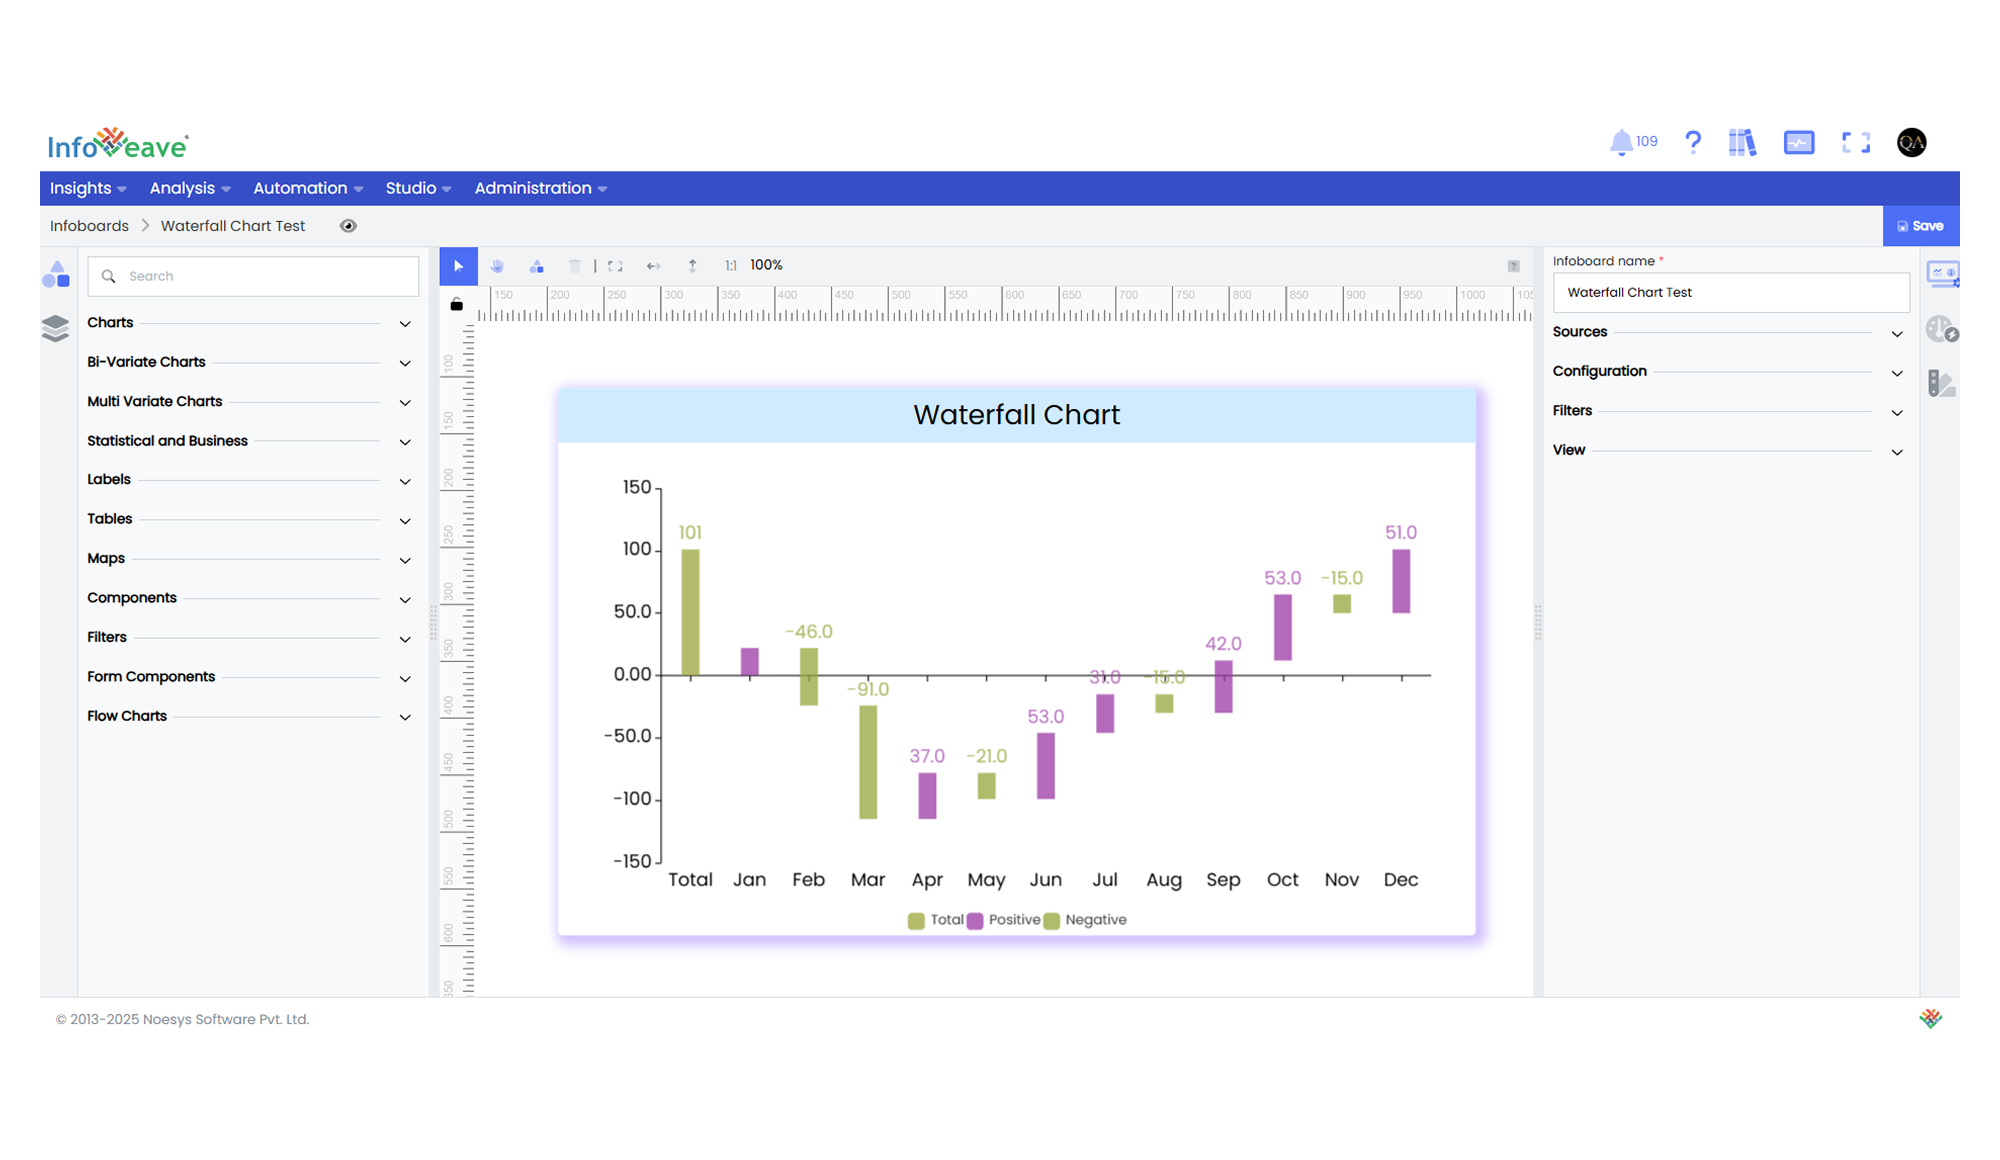
A **Waterfall Chart** is a specialized bar chart that displays how an initial value is affected by a series of positive and negative values. Each bar represents an incremental change, while the cumulative total is displayed either at the start or the end of the sequence.
This chart is ideal for illustrating how sequential factors contribute to a final value — for example, showing how various departments impact a company's net profit, or how individual items affect total expenses.
**Key Features:**
- Visualizes **incremental changes** (positive/negative) and cumulative totals.
- Configurable total bar placement — **start** or **end**.
- Uses **custom render functions** for precise control over individual bars.
- Interactive tooltips, zooming, and optional heatmaps.
- Supports numerical axis scaling (linear or logarithmic).
- Dynamic legend and color customization for Positive, Negative, and Total bars.
**Typical use cases:**
- Profit and loss statements.
- Sales variance analysis.
- Budget vs. actual analysis.
- Market share contribution breakdown.
- Sequential financial impact visualizations.
---
## ⚙️ Setup
1. Drag the **Waterfall Chart** widget from the chart library onto your designer workspace.
2. Select the chart.
3. Go to the [Widget Configuration](/insights-v8/guide-to-infoboard-designer/customize-panel/configure/) tab in the Customize panel.
4. Under the Configuration tab, select the [Basic Configuration](/insights-v8/guide-to-infoboard-designer/customize-panel/configure/#basic) option to access the essential settings for the waterfall chart.
5. Select the [Source](/insights-v8/guide-to-infoboard-designer/customize-panel/setup/#sources) which the chart will pull the data from the option.
6. Map:
- **[Value (Measure)](/studio-v8/datasources/measures-dimensions-and-hierarchies/)** — The incremental numeric value for each step.
- **[Axis (Dimension)](/studio-v8/datasources/measures-dimensions-and-hierarchies/)** — The category along the horizontal axis (e.g. Month, Department).
7. Optionally add a **Date** field for time-based filtering.
8. Enable **Hide Zero Values** to omit symbols with zero values if needed.
---
## 📊 Basic Configuration
| Configuration Item | Description |
|:------------------|:----------------------------|
| **[Source](/insights-v8/guide-to-infoboard-designer/customize-panel/setup/#sources)** | Source providing the data for measures and dimensions. |
| **[Value](/studio-v8/datasources/measures-dimensions-and-hierarchies/)** | Numeric value representing the incremental change. |
| **[Axis](/studio-v8/datasources/measures-dimensions-and-hierarchies/)** | Categorical field representing each sequential step. |
| **Date Field** (optional) | Date dimension for time-based data filtering. |
| **Hide Zero Values** | Option to suppress symbols with zero value from display. |
---
## 🎨 Chart Customizations
| Category | Options & Description |
|:---------|:-------------------------------------------------|
| **[General](/insights-v8/guide-to-infoboard-designer/customize-panel/customization-tab/#general)** | Modify the chart’s general appearance, including the background color, borders, shadows, and drill-out choices.
| **[Title](/insights-v8/guide-to-infoboard-designer/customize-panel/customization-tab/#title)** | Enable and customize chart title text, alignment, font, and color. |
| **[Sorting](/insights-v8/guide-to-infoboard-designer/customize-panel/customization-tab/#sorting)** | Define custom sort orders for categories along the X and Y axes. |
| **[Grid](/insights-v8/guide-to-infoboard-designer/customize-panel/customization-tab/#grid)** | Adjust chart margins, grid spacing, and padding around the matrix area. |
| **[Legend](/insights-v8/guide-to-infoboard-designer/customize-panel/customization-tab/#legends)** | Toggle visibility, position, orientation, and customize legend labels and icons. |
| **[Categorical Axis (X, Y)](/insights-v8/guide-to-infoboard-designer/customize-panel/customization-tab/#categorical-axis)** | Customize axis labels, intervals, rotation, visibility, and range sliders for both axes. |
| **[Numerical Axis](/insights-v8/guide-to-infoboard-designer/customize-panel/customization-tab/#numerical-axis)** | Set numeric axis range, formatting, and scale type (linear/log). |
| **[Series](/insights-v8/guide-to-infoboard-designer/customize-panel/customization-tab/#series-customization)** | Define bar widths, colors, and bar rendering options. |
| **[Tooltip](/insights-v8/guide-to-infoboard-designer/customize-panel/customization-tab/#tooltip)** | Control tooltip content, formatting, and visibility on hover. |
| **Others** | Configure **Total Bar Position** (start/end of the sequence). |
---
## 📊 Example Visualization