---
title: "Bi-Variate Pie"
description: "Multi-panel pie charts that display category-wise contributions across multiple split dimensions with extensive label, color, and position customizations."
group: Charts
tags: [Visualization, Pie Chart, Multi-Panel, Composition]
---
import { Aside, Steps } from '@astrojs/starlight/components';
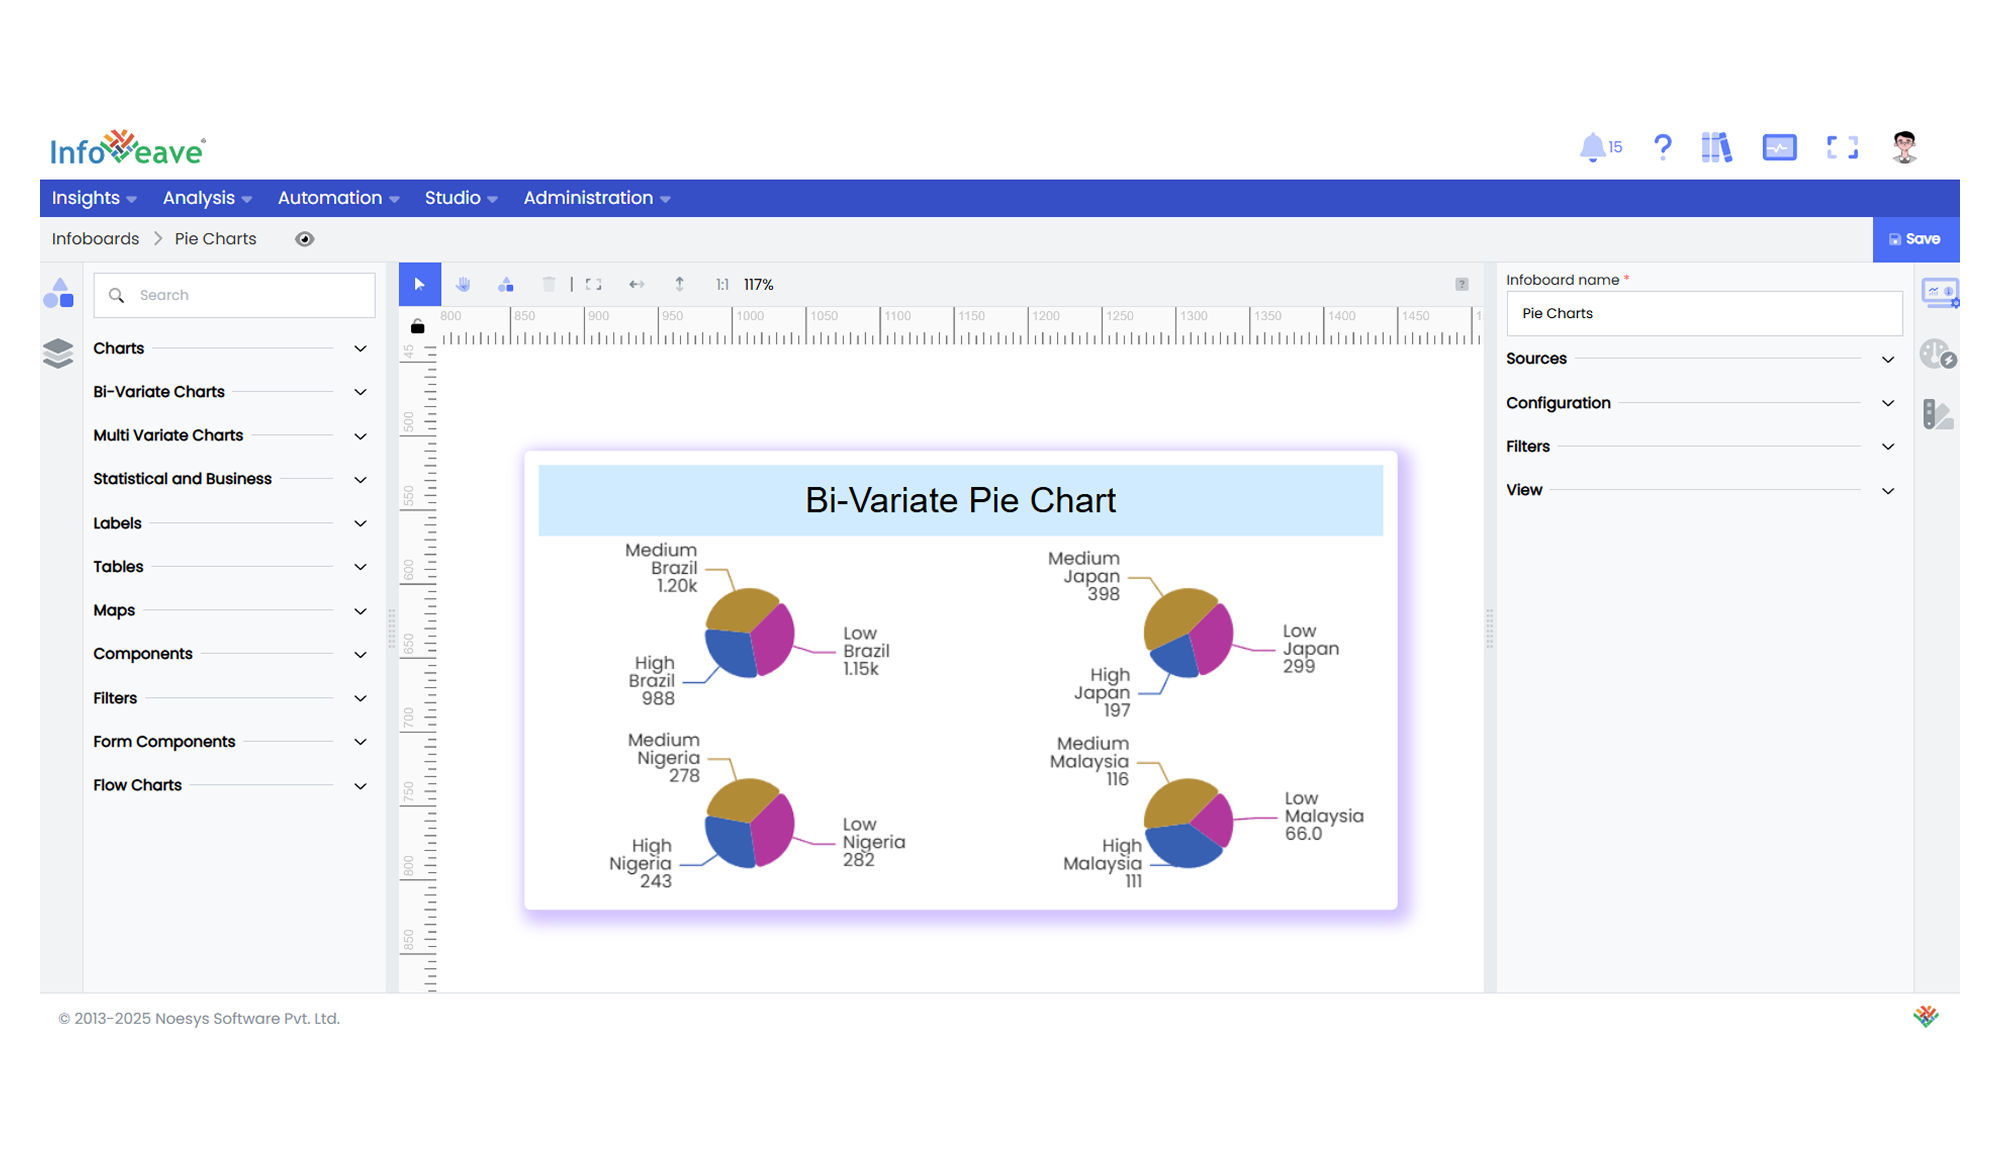
# Bi-Variate Pie
The **BiVariate Pie Chart** visualizes category-wise distribution as pie slices, split across multiple grids based on a chosen dimension. It supports flexible label positioning, rose charts, border radii, and custom coloring per category.
**Key Features:**
- Multi-grid pie charts using **Split** dimension.
- Optional **rose chart** variations (`None`, `Radius`, `Area`).
- Per-category **custom colors** or palette-based coloring.
- Adjustable **label position**, orientation, and content.
- Configurable inner and outer radius for donut effects.
- Optional **start angle rotation** and clockwise settings.
- Grid layout with configurable **rows, columns, and gaps**.
- Rich tooltips and accessible ARIA support.
**Use Cases:**
- Comparing category-wise breakdowns across multiple regions, periods, or product types.
- Visualizing proportional data with advanced label and color controls.
- Building rose charts for cyclic or directional data insights.
- Pie charts with multi-panel layout for segmented analysis.
---
## ⚙️ Setup
1. Add a **BiVariate Pie Chart** widget from the chart library onto your designer workspace.
2. Select the chart.
3. Go to the [Widget Configuration](/insights-v8/guide-to-infoboard-designer/customize-panel/configure/) tab in the Customize panel.
4. Under the Configuration tab, select the [Basic Configuration](/insights-v8/guide-to-infoboard-designer/customize-panel/configure/#basic) option to access the essential settings for the bi variate pie chart.
5. Select the [Source](/insights-v8/guide-to-infoboard-designer/customize-panel/setup/#sources) which the chart will pull the data from the option.
6. Map:
- **[Measure](/studio-v8/datasources/measures-dimensions-and-hierarchies/)** — Numeric value for slice size.
- **[Dimension](/studio-v8/datasources/measures-dimensions-and-hierarchies/)** — Categorical dimension for pie slice labels.
- **[Split](/studio-v8/datasources/measures-dimensions-and-hierarchies/)** — Dimension to split data into multiple pie charts.
7. Optionally add a **Date** field for time-based filtering.
8. Enable **Hide Zero Values** to omit symbols with zero values if needed.
---
## 📊 Basic Configuration
| Configuration Item | Description |
|:------------------|:------------------------------------------------|
| **[Source](/insights-v8/guide-to-infoboard-designer/customize-panel/setup/#sources)** | Source providing the data for measures and dimensions. |
| **[Measure](/studio-v8/datasources/measures-dimensions-and-hierarchies/)** | Numeric measure representing slice size. |
| **[Dimension](/studio-v8/datasources/measures-dimensions-and-hierarchies/)** | Categorical field for pie slices. |
| **[Split](/studio-v8/datasources/measures-dimensions-and-hierarchies/)** | Field to split pie charts across panels. |
---
## 🎨 Chart Customizations
| Category | Options & Description |
|:------------|:------------------------------------------------|
| **[General](/insights-v8/guide-to-infoboard-designer/customize-panel/customization-tab/#general)** | Modify the chart’s general appearance, including the background color, borders, shadows, and drill-out choices.
| **[Title](/insights-v8/guide-to-infoboard-designer/customize-panel/customization-tab/#title)** | Enable and customize chart title text, alignment, font, and color. |
| **[Sorting](/insights-v8/guide-to-infoboard-designer/customize-panel/customization-tab/#sorting)** | Define custom sort orders for categories along the X and Y axes. |
| **[Position](/insights-v8/guide-to-infoboard-designer/customize-panel/customization-tab/#position)** | Overall horizontal and vertical offset for chart layout. |
| **[Grid](/insights-v8/guide-to-infoboard-designer/customize-panel/customization-tab/#grid)** | Adjust chart margins, grid spacing, and padding around the matrix area. |
| **[Legend](/insights-v8/guide-to-infoboard-designer/customize-panel/customization-tab/#legends)** | Toggle visibility, position, orientation, and customize legend labels and icons. |
| **[Series](/insights-v8/guide-to-infoboard-designer/customize-panel/customization-tab/#series-customization)** | Label visibility, position, overlap handling, orientation, custom colors, and shadow effects. |
| **[Tooltip](/insights-v8/guide-to-infoboard-designer/customize-panel/customization-tab/#tooltip)** | Rich hover info for slices. |
| **[Others]** | Clockwise setting, radius adjustments, border radius, rotation, and rose chart type. |
---
## 📊 Example Visualization