---
title: Google Analytics
description: Integrate cloud data sources like Google Analytics, Amazon Redshift, and Data World for seamless analysis and visualization.
---
import { Aside , Steps} from '@astrojs/starlight/components';
# Google Analytics
Infoveave seamlessly integrates with various cloud-based servers. This allows you to effortlessly access, analyze, and derive insights from your cloud-hosted data. Infoveave supports Datasource creation from databases like Amazon Athena, Amazon Redshift, Data World, and Google Analytics.
## Creating a Datasource using Google Analytics
1. To access Infoveave Datasource types, navigate to **Studio** **Datasources**. All types of Datasources created by you or shared with you will be displayed under **My Datasources** and **Shared Datasources**.
2. To create a new Datasource, click on **New Datasource**.
1. Choose **Google Analytics** under Cloud Services as the Datasource type.
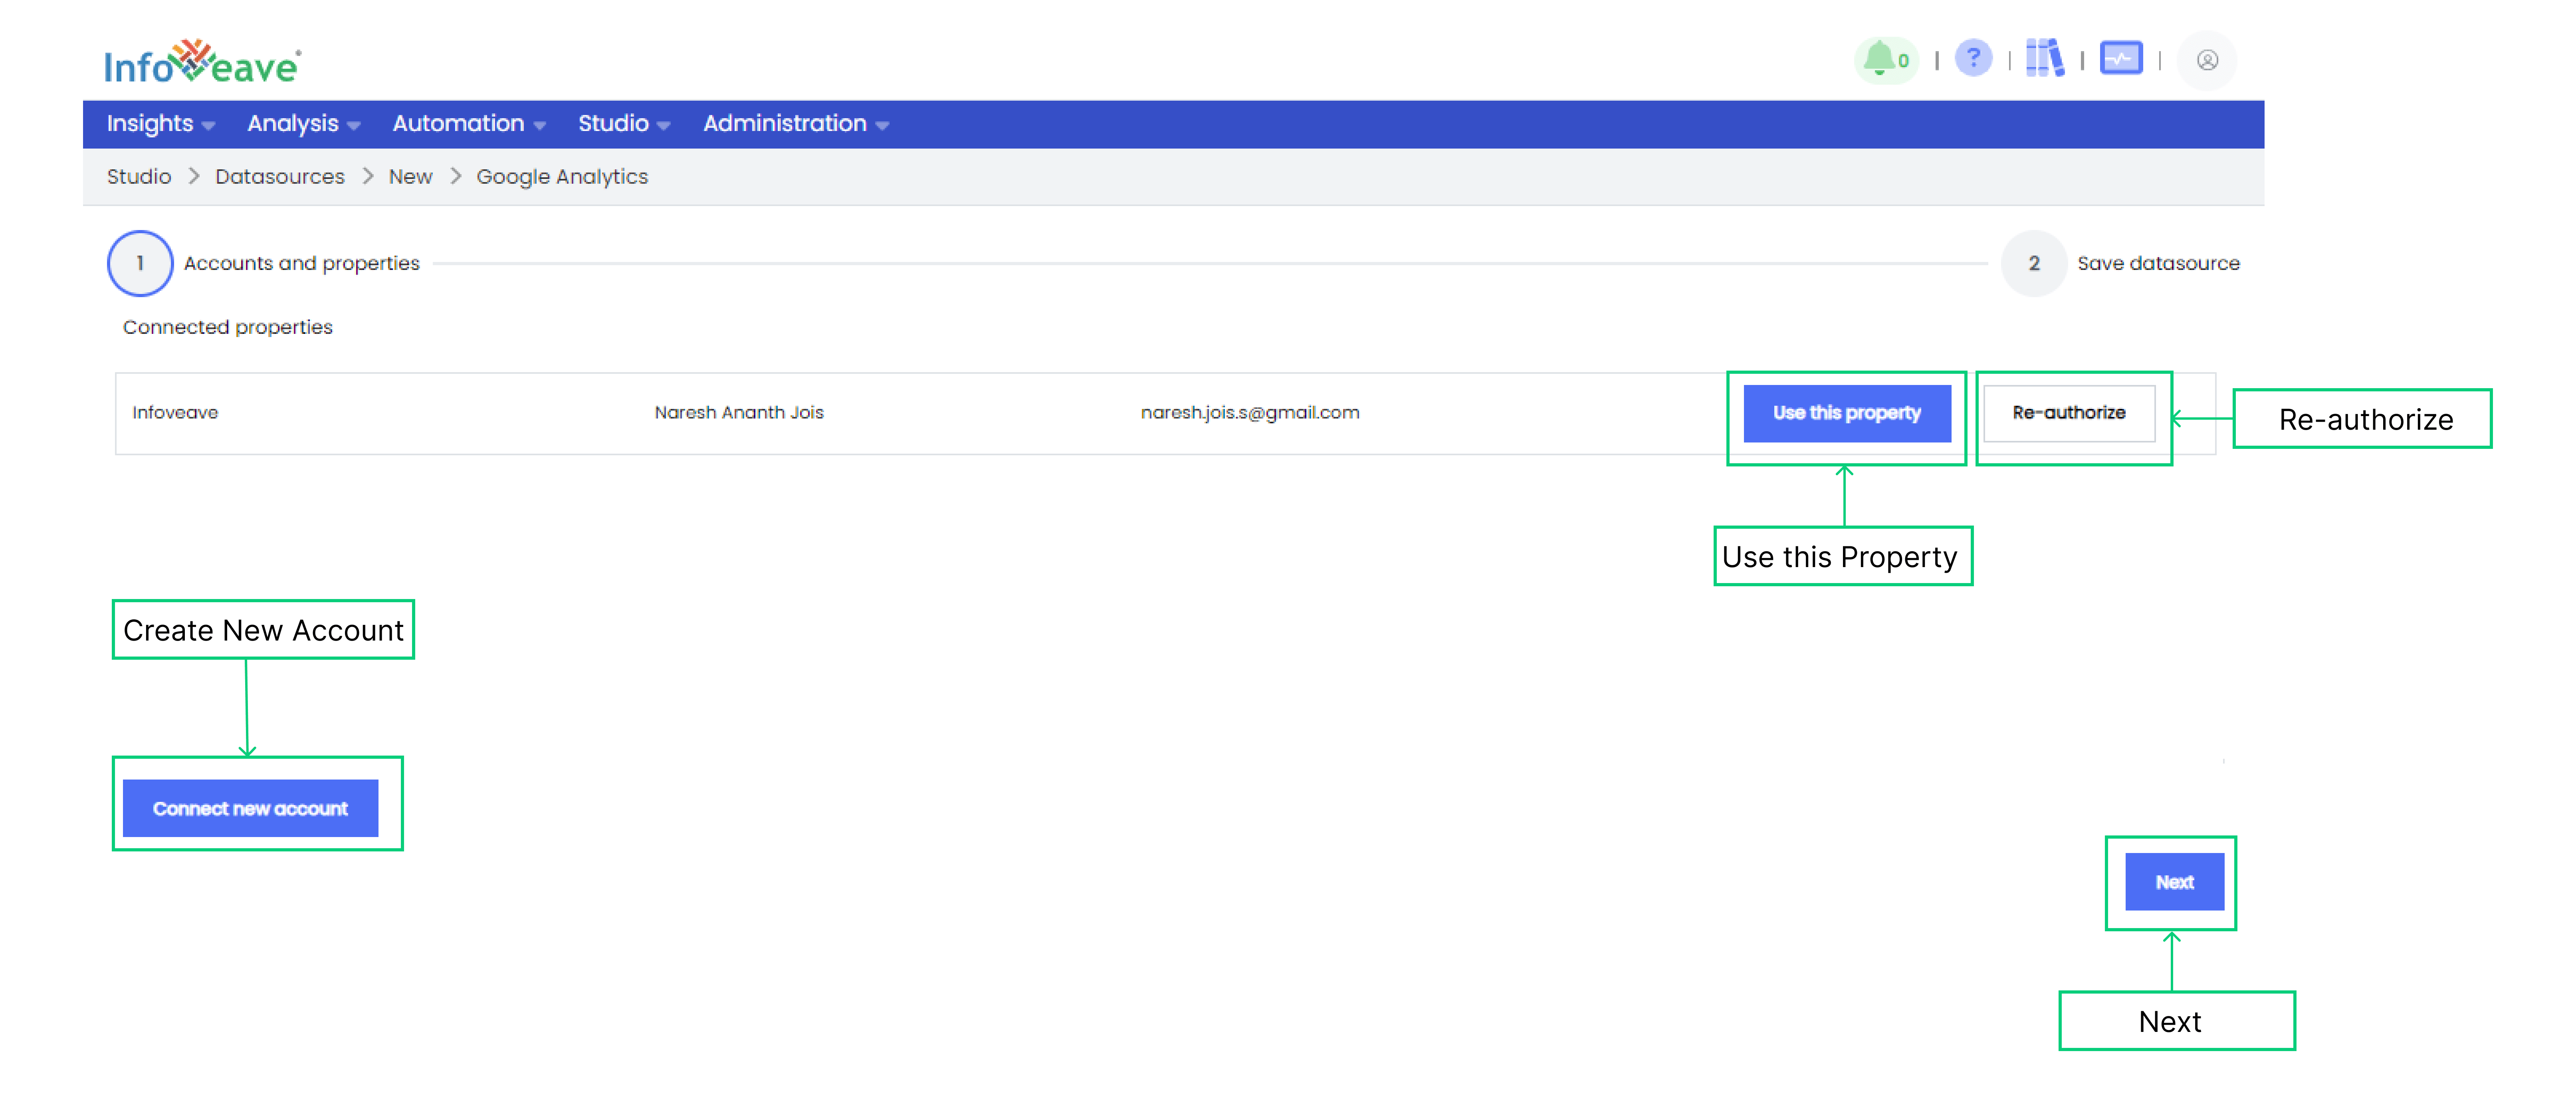
3. A new window opens for the Datasource creation process.
4. In this window, you can see all previously connected Google Analytics accounts, if any.
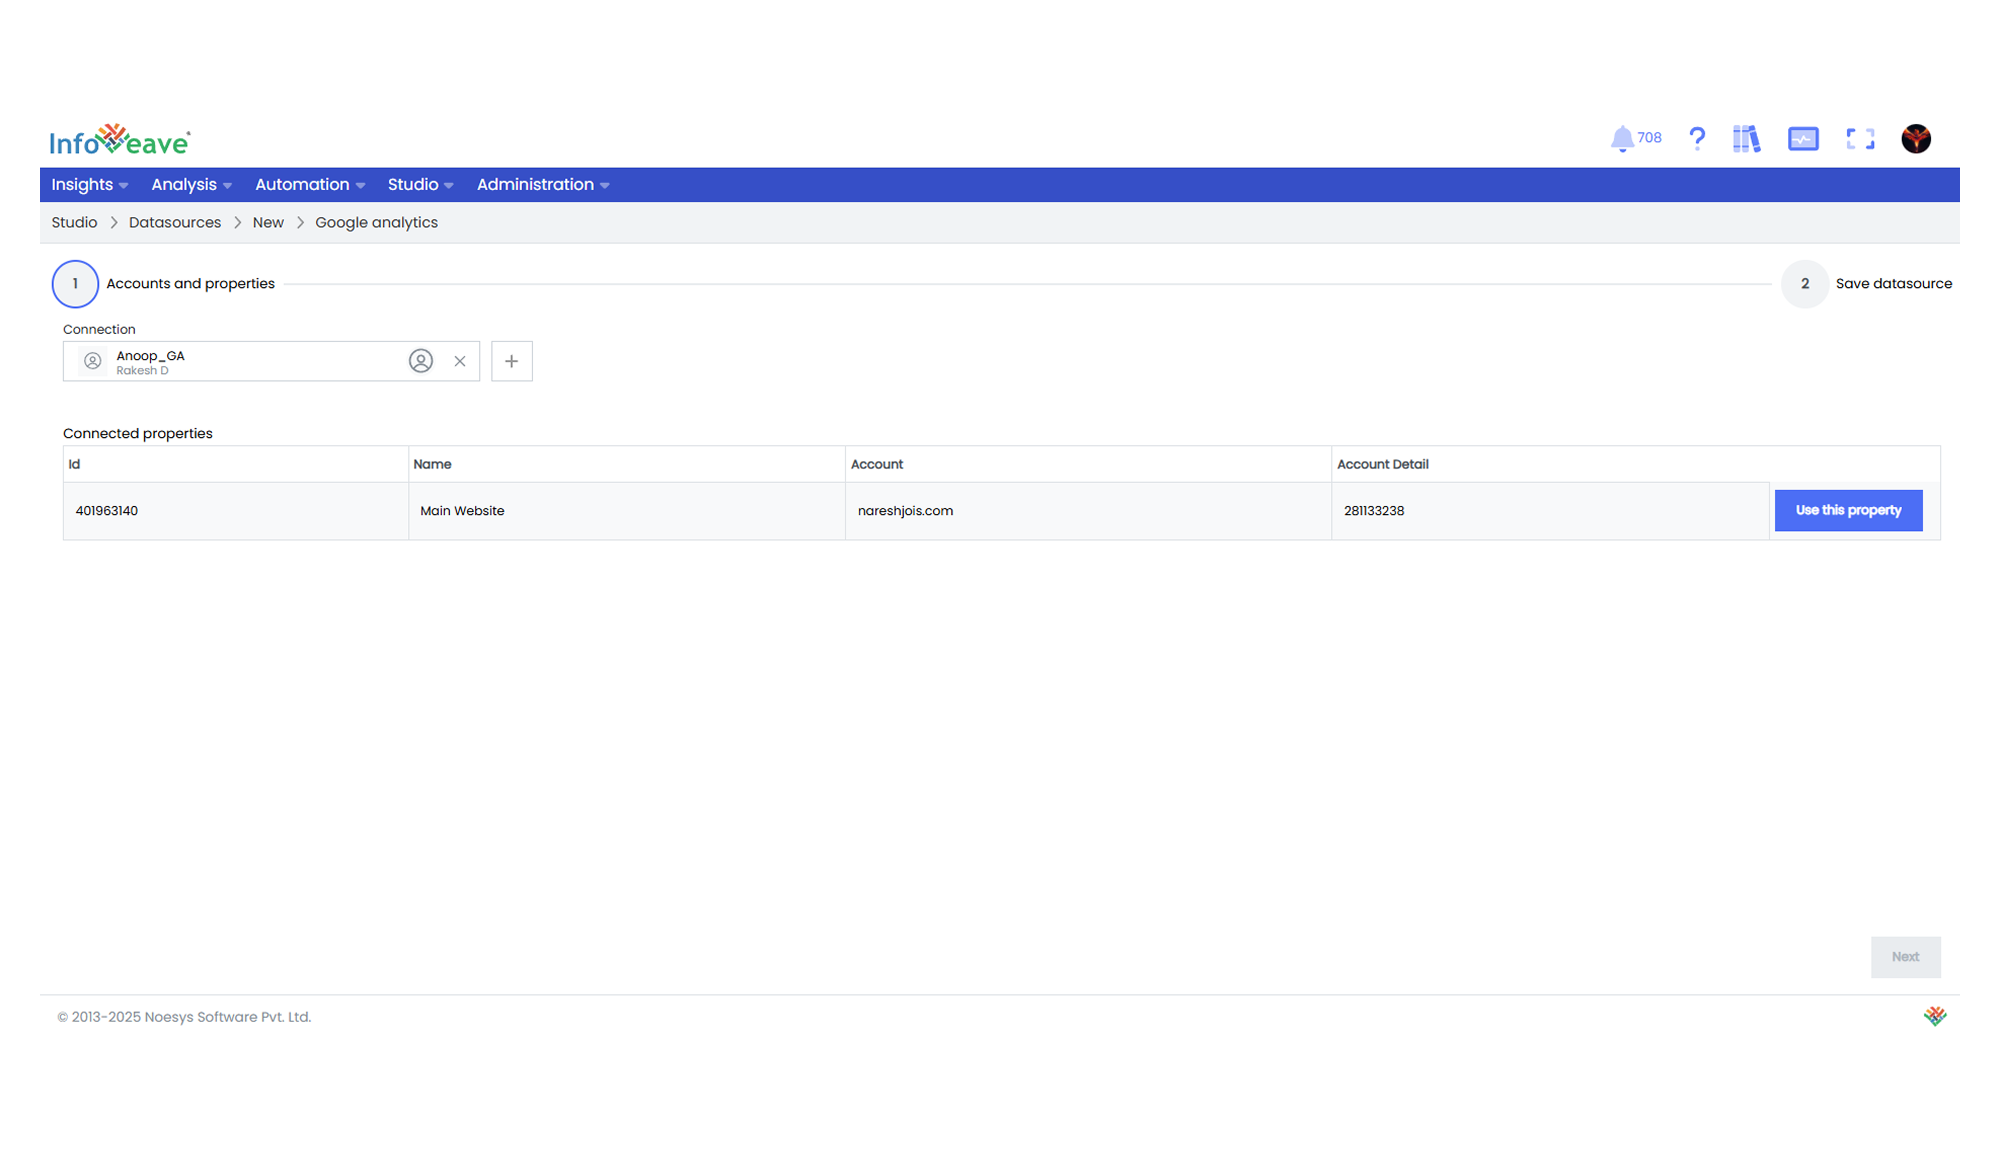
5. To use an existing account, click on **Use this property** across the established connection.
6. Name the Datasource. Choose a name that reflects the Datasource for easy identification.
7. Enable measures and dimensions based on your requirements.
8. Click on **Save** to save the Datasource.
9. To add a new Google Analytics connection, click on the **Add connection +** icon.
10. A popup modal appears asking you to enter your Google Analytics credentials.
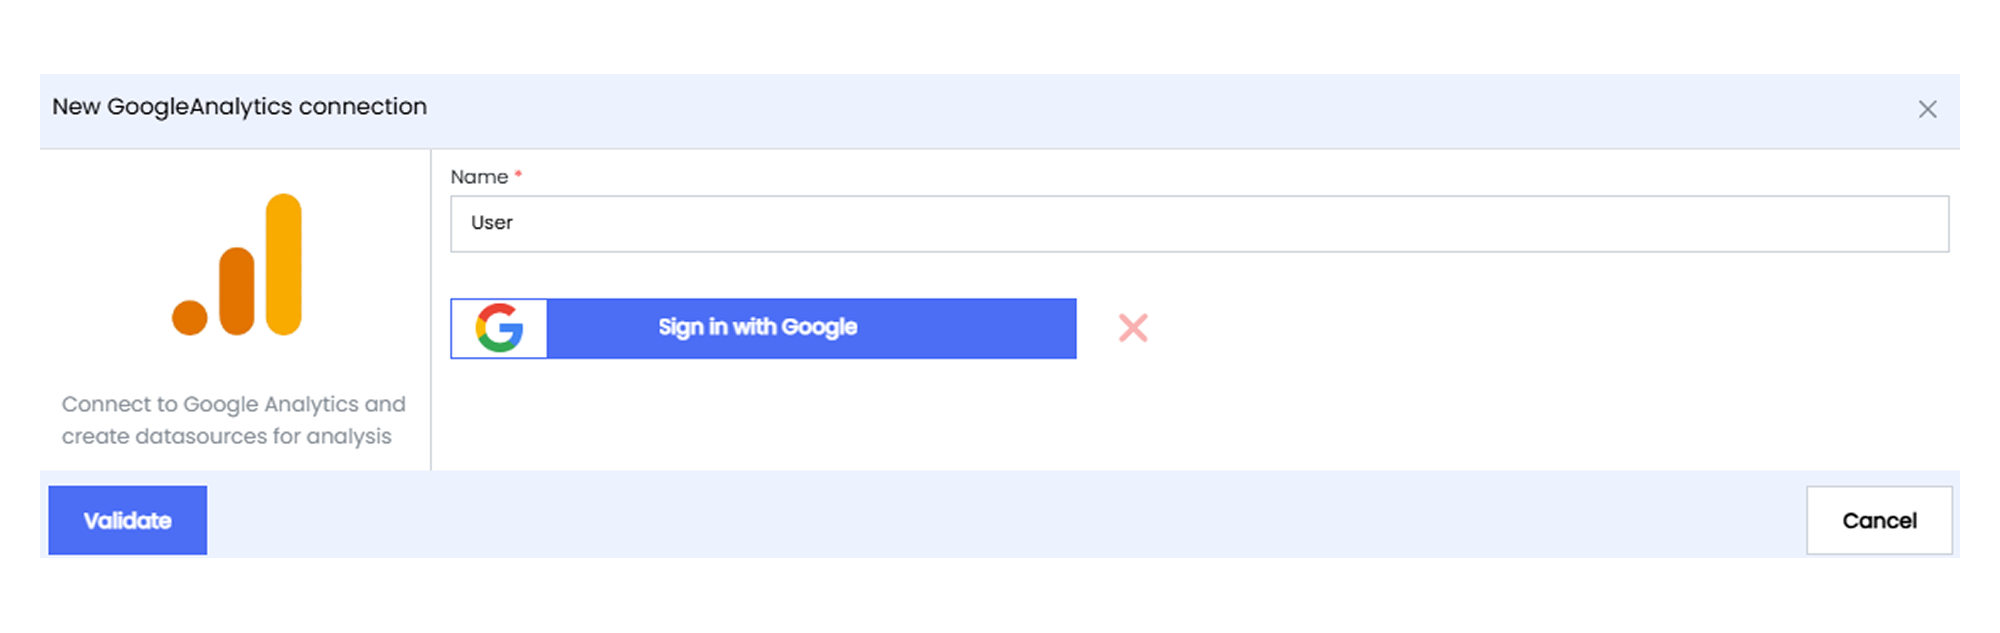
11. This action establishes the connection between Infoveave and your Google Analytics account.
12. Click on **Validate** to validate the connection.
13. Click on **Save** to save the connection.