---
title: Infoboard statistics
description: View detailed Infoboard statistics in Infoveave, including visit data, engagement patterns, and date range filters for accurate analysis.
---
# Infoboard statistics
import { Aside, Steps } from '@astrojs/starlight/components';
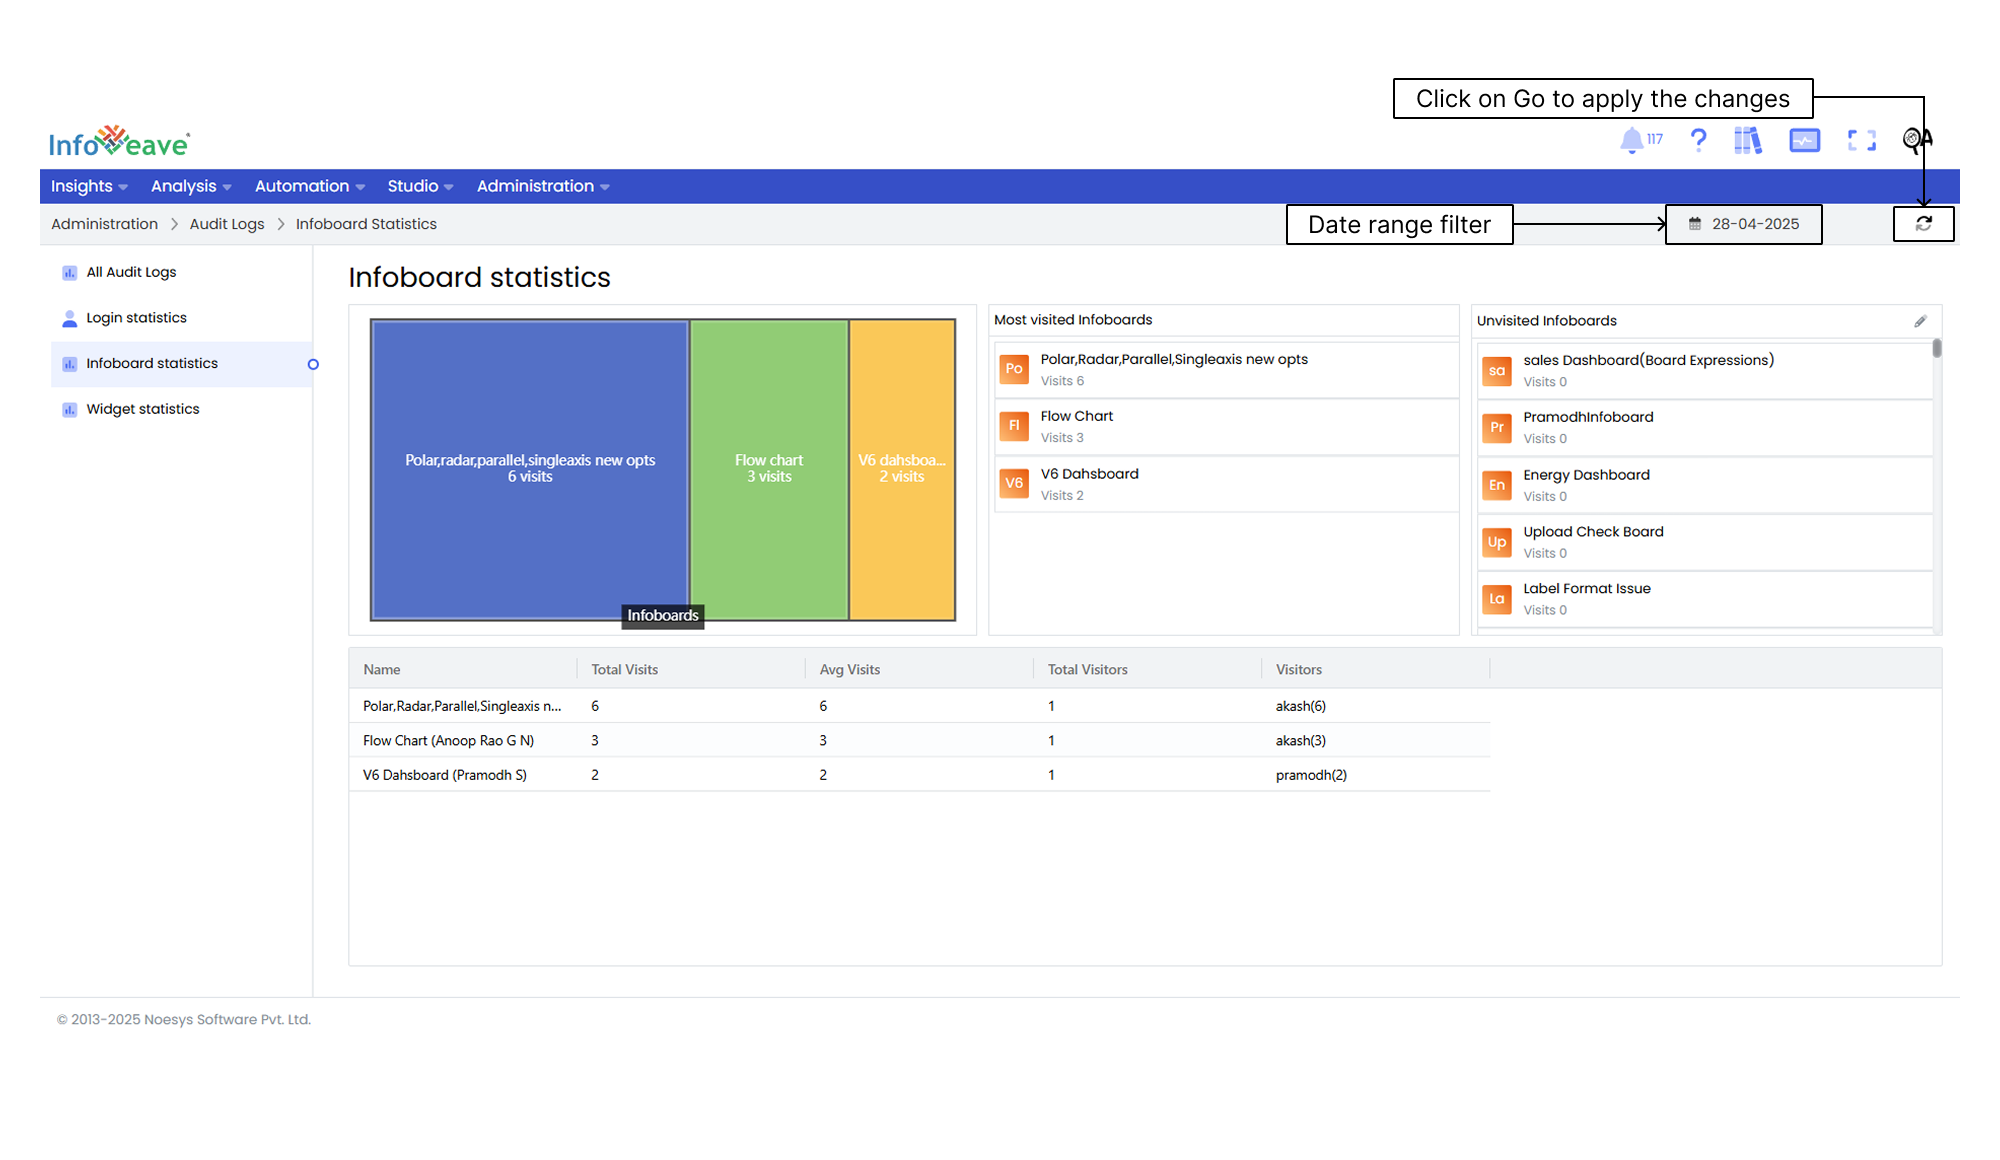
The Infoboard statistics feature in Infoveave provides a comprehensive overview of user activities and engagement patterns on Infoboards. It includes details such as Name, Average Visit, Total Visitor, Total Visits, and Visitor Name. You can also apply a date range filter to analyze specific time periods by selecting the start and end dates with granularity options.
Here are the steps to access and interpret Infoboard statistics.
1. Once you log in, click on the **Infoboard statistics** under **Administration Audit Logs** in the Infoveave interface. After accessing the Infoboard statistics section, you will see a view displaying Infoboard access frequencies and related data.
2. In the Infoboard statistics section, you can identify both frequently visited Infoboards and unvisited Infoboards.
- The statistics table provides detailed information about user activities. This includes Name, Average Visit, Total Visitor, Total Visits, and Visitor Name.
- A column chart visually displays the number of visits for the Infoboards. This chart gives you a quick overview of Infoboard engagement trends.
3. If necessary, take action to manage unvisited Infoboards. Click on the **Edit** icon associated with the unvisited Infoboards tab or **Delete** unvisited Infoboards from the system.
4. Apply the **Date range filter** to the Infoboard statistics for more detailed insights if required.
5. Click on the **Go** button to apply the selected date range.